Qfin Holdings, Inc.'s management explains the business in its own materials. The slides below do the most of that work, pulled from the documents preserved in Sources. Each source link opens the complete presentation at that slide in a new tab.
The current investor-overview deck: how the platform makes money, its business models, AI engine, strategy, and the latest operating data — the fastest zero-to-understanding read on QFIN. · Open the full document →
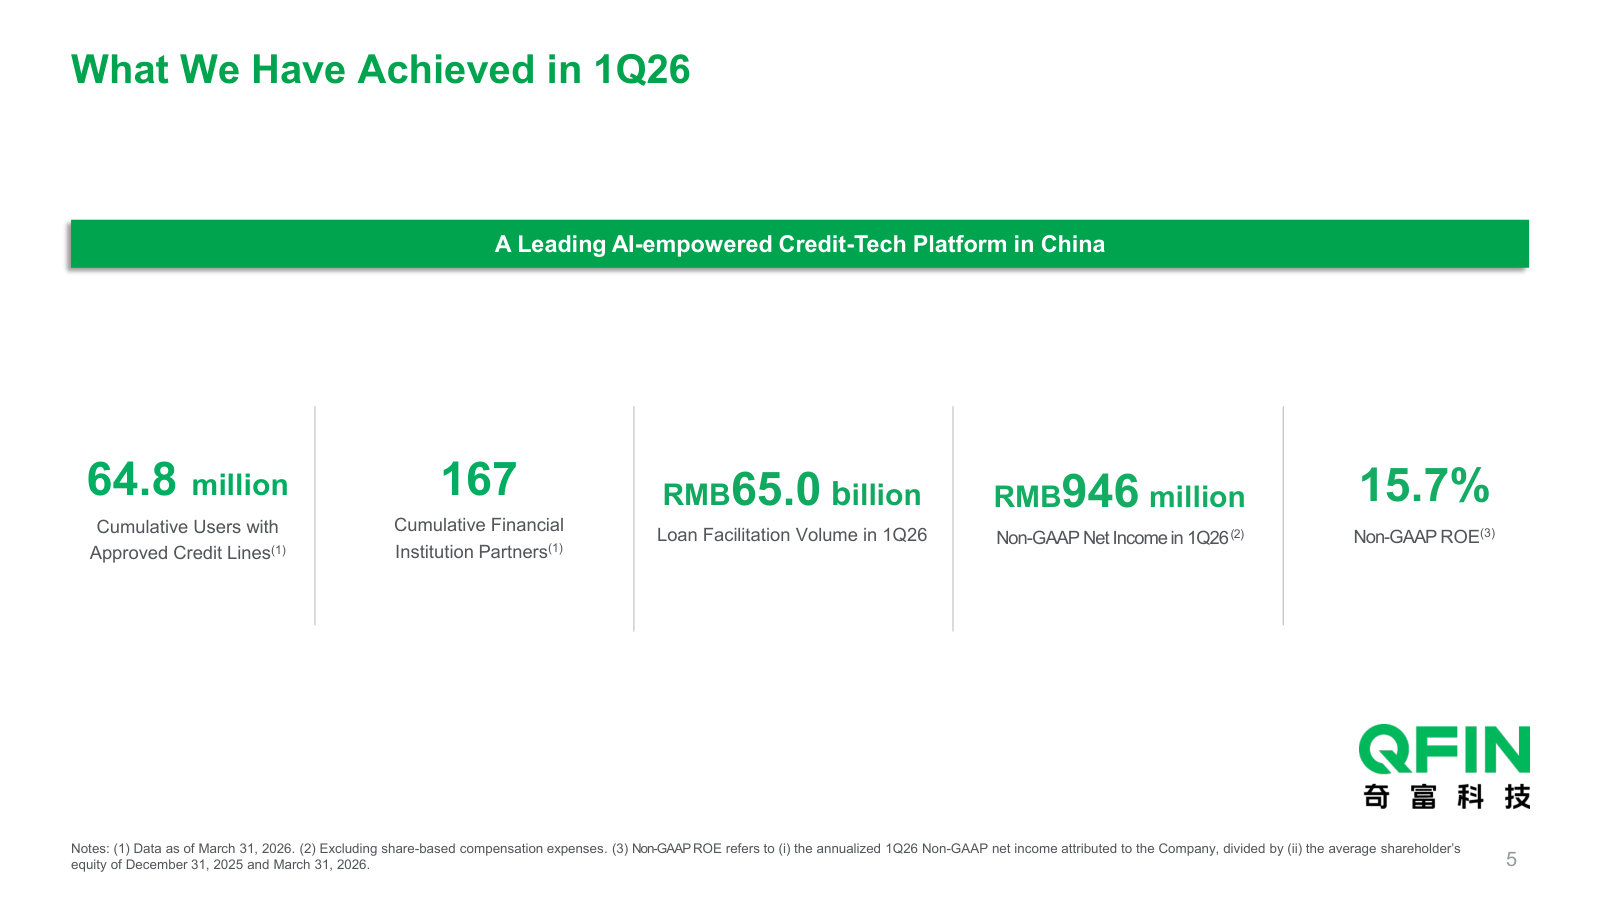
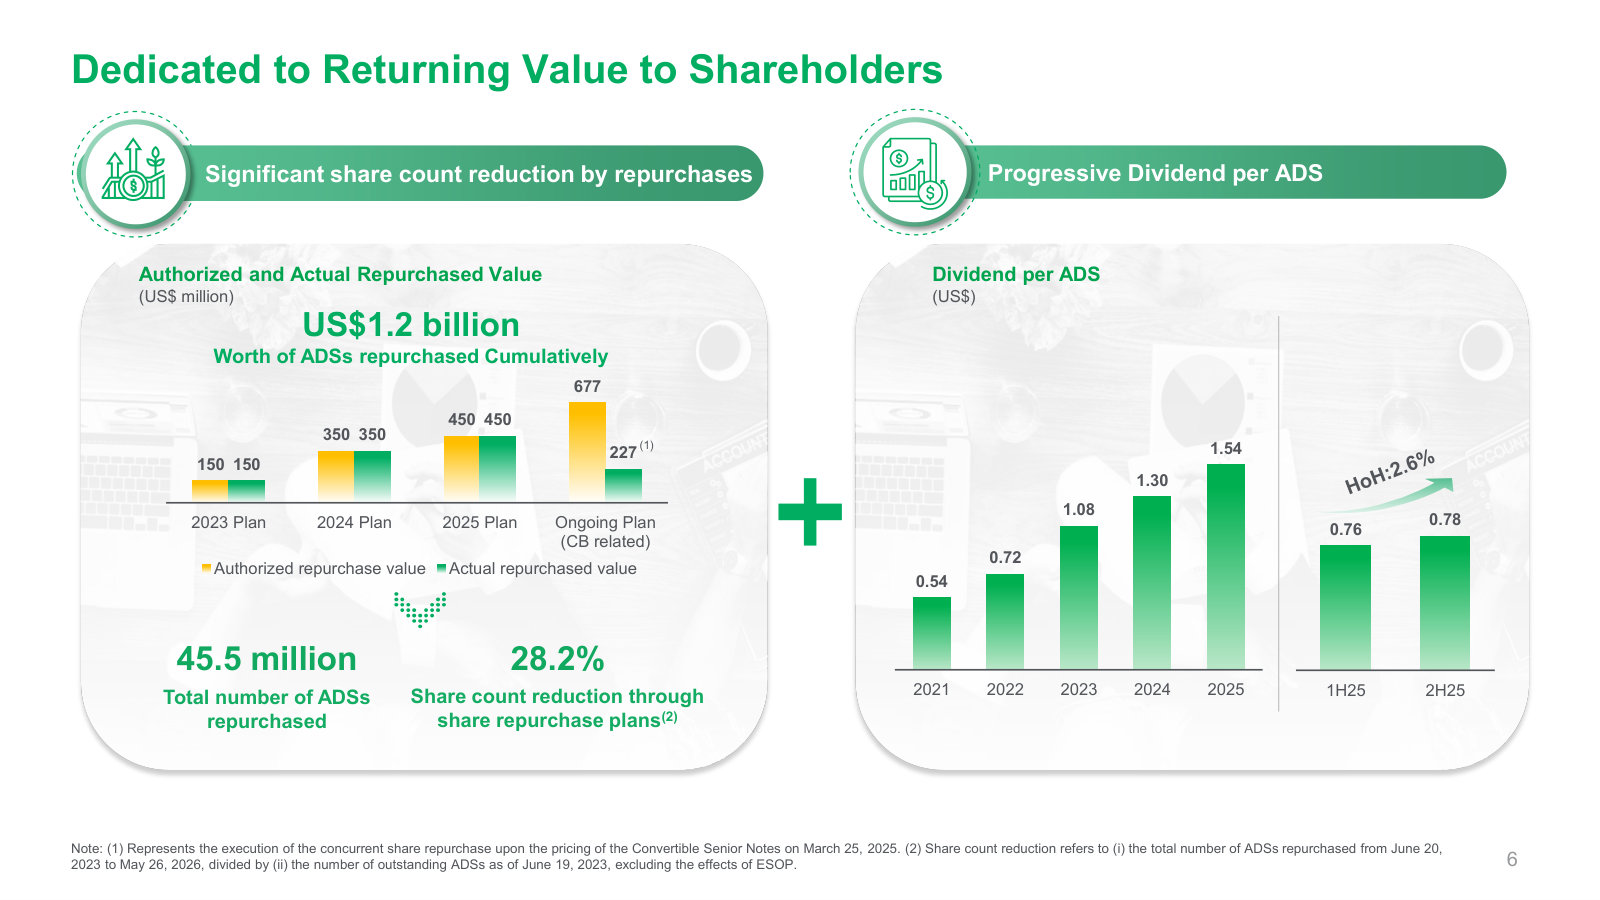
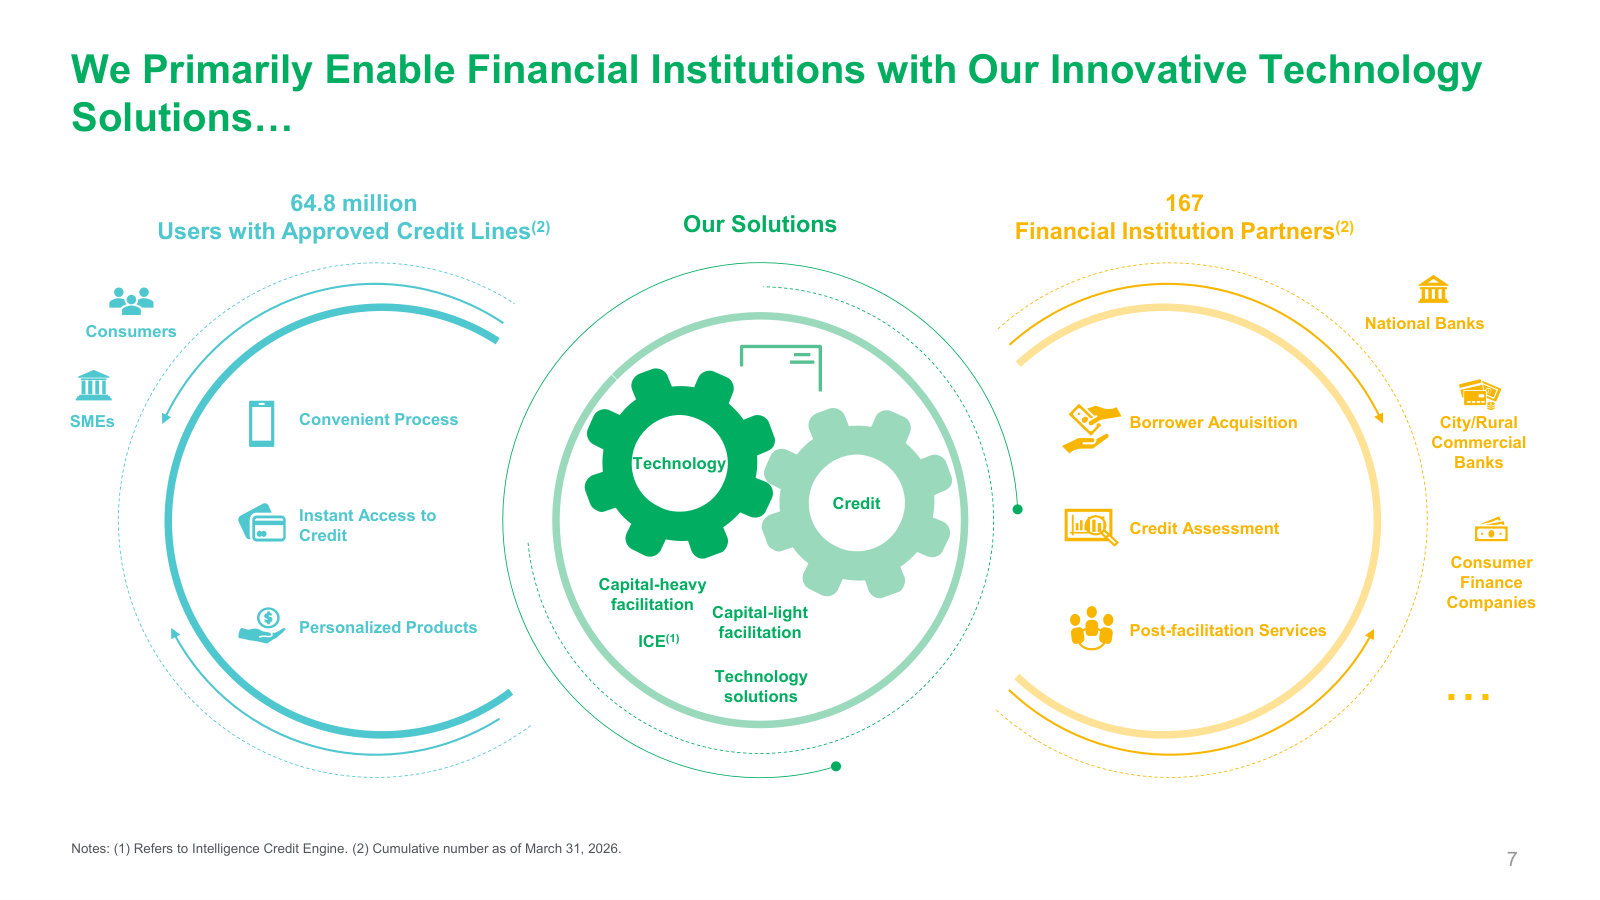
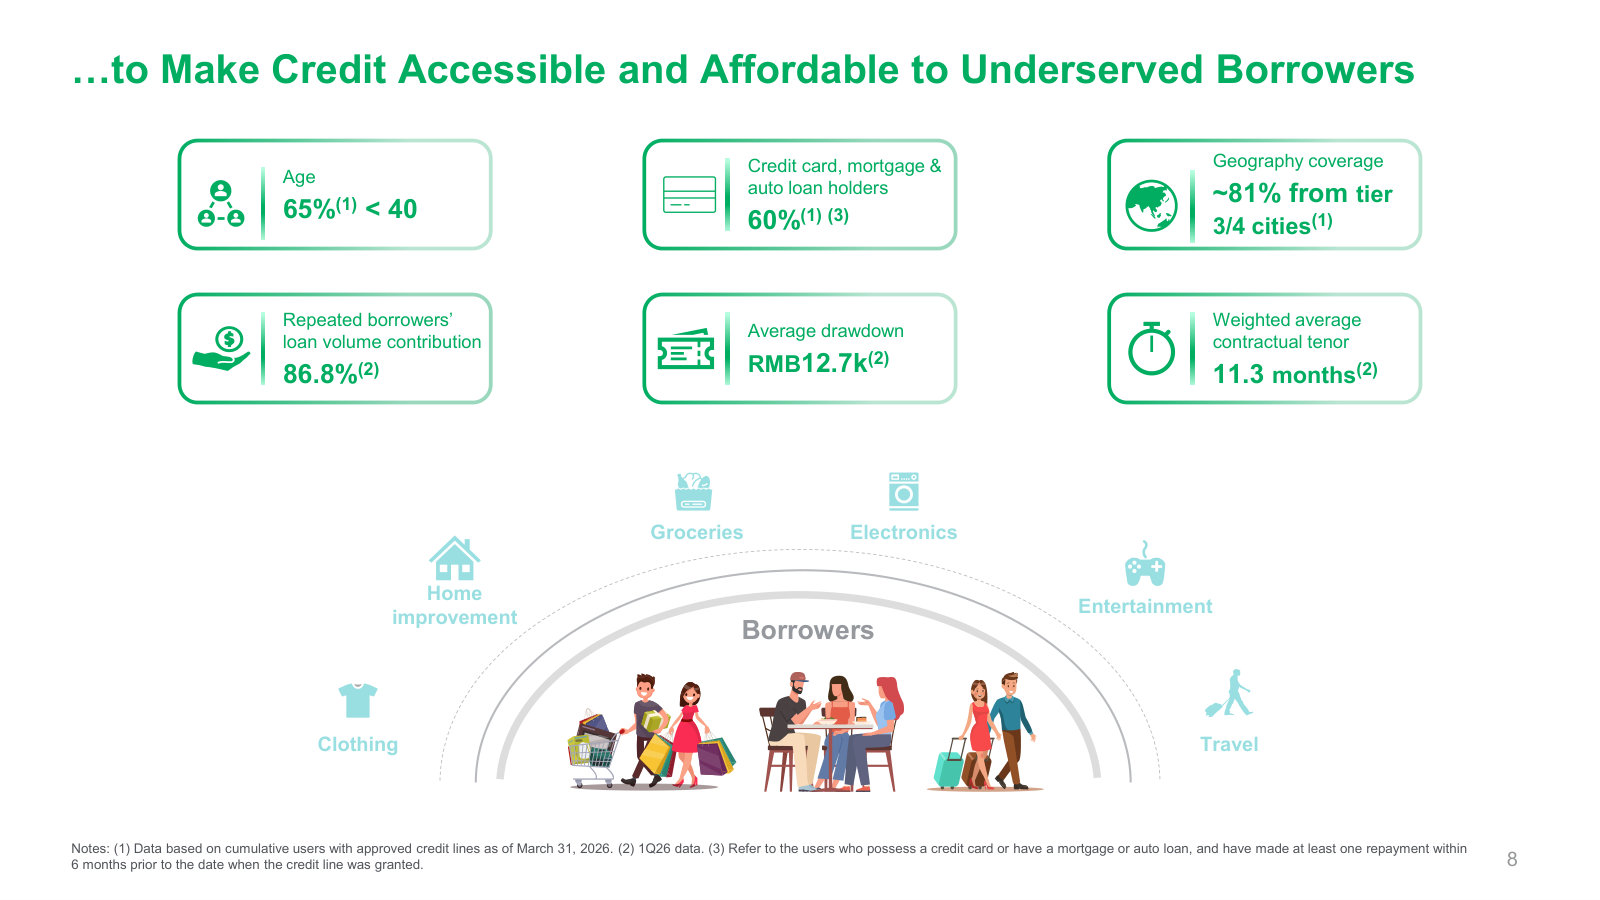
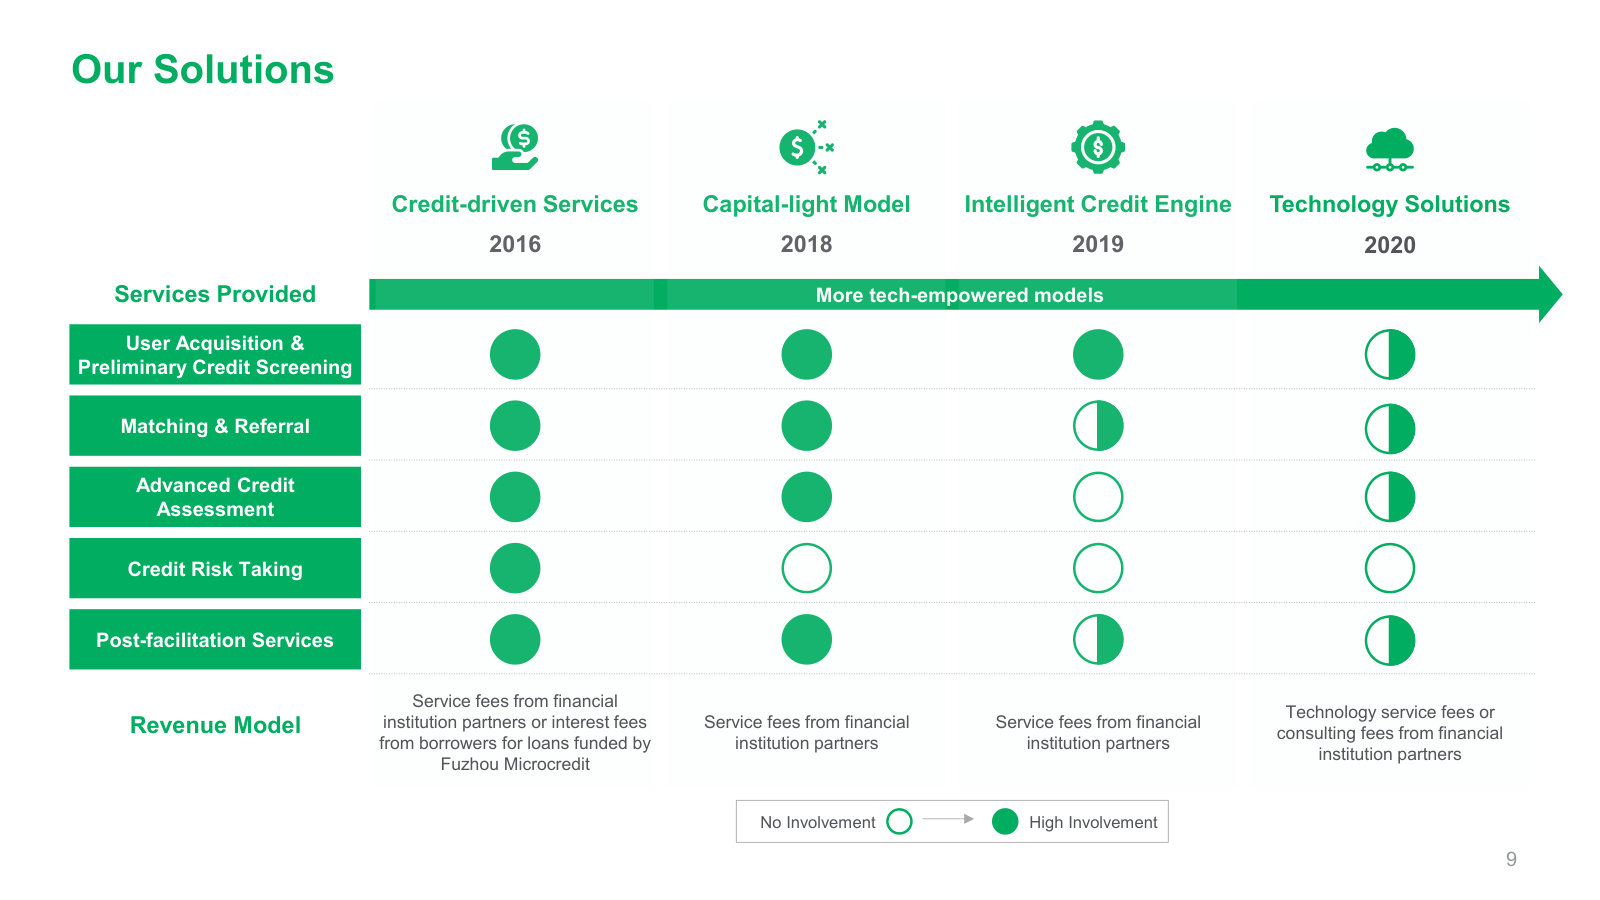
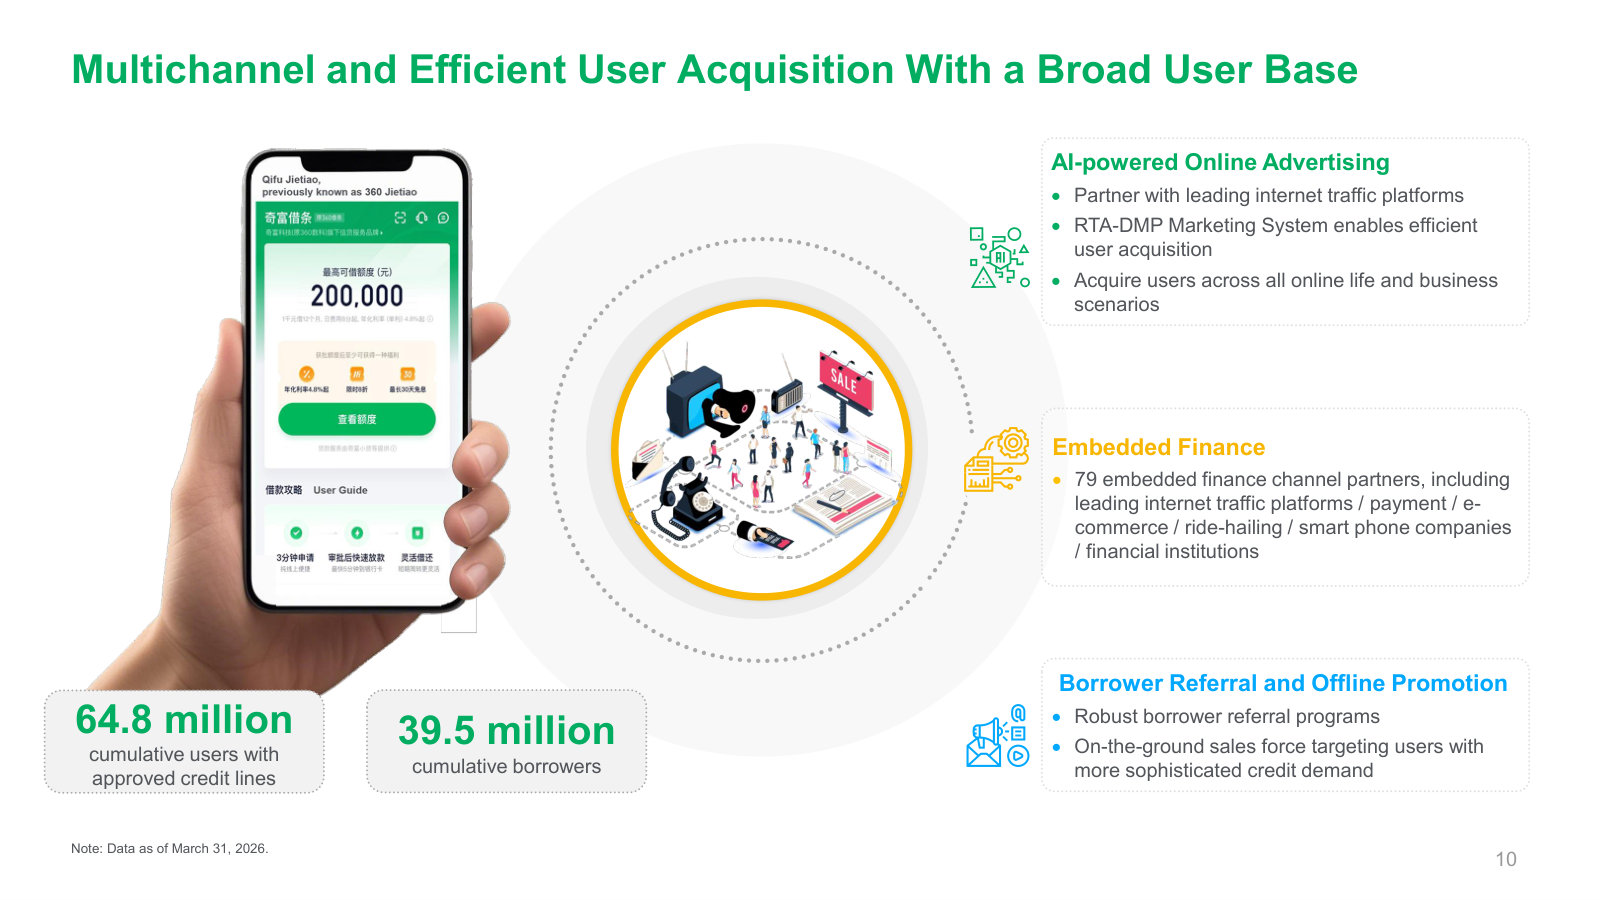
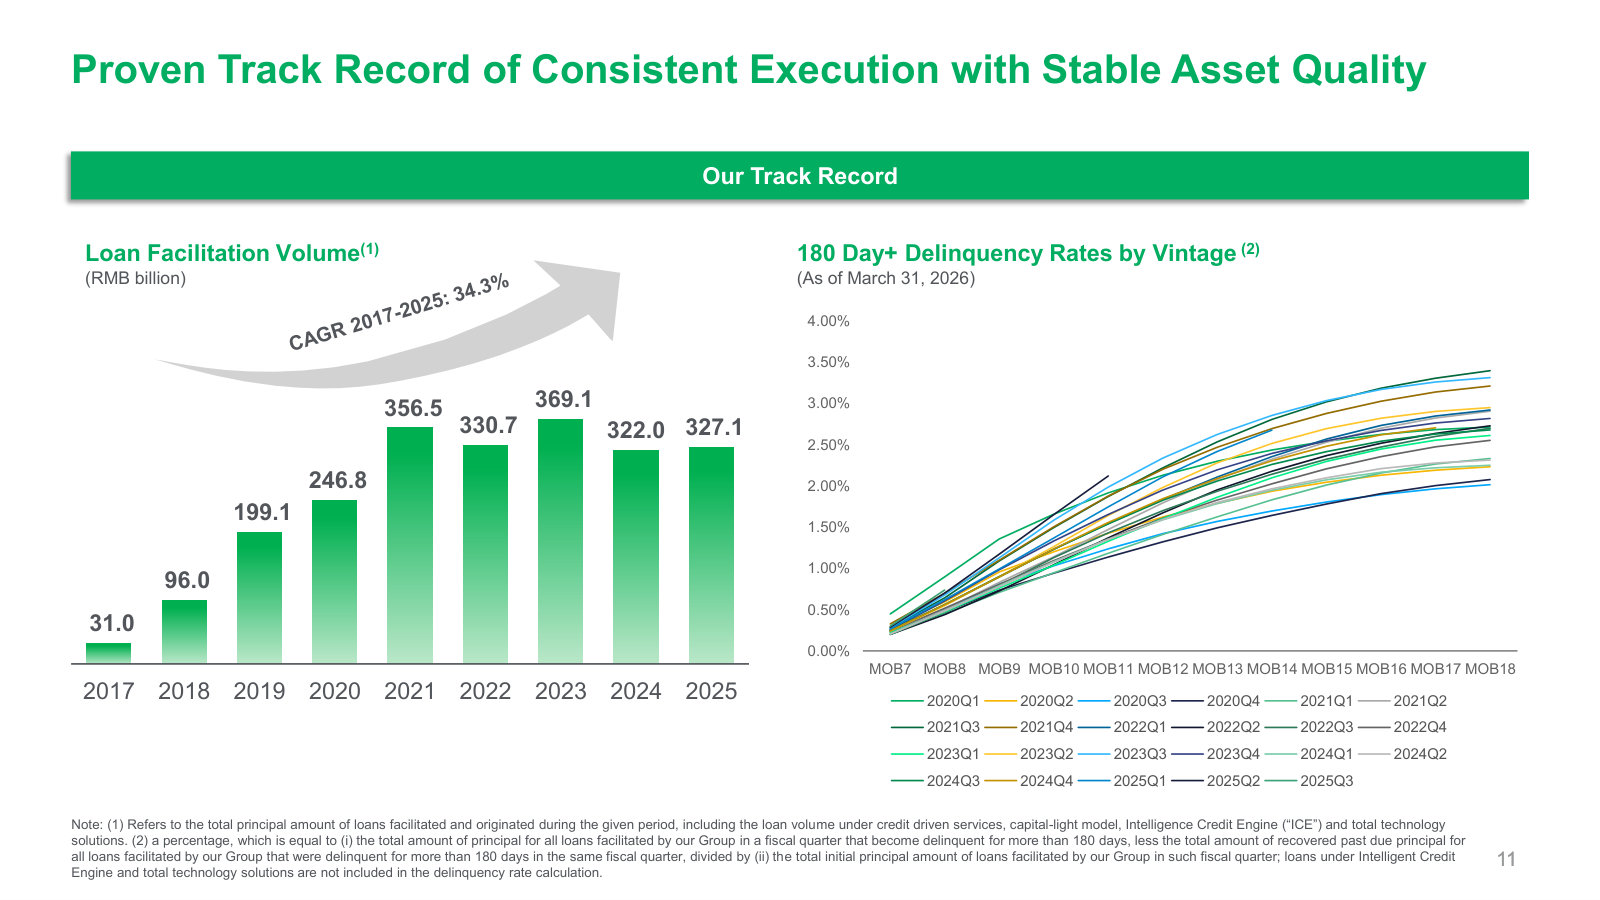
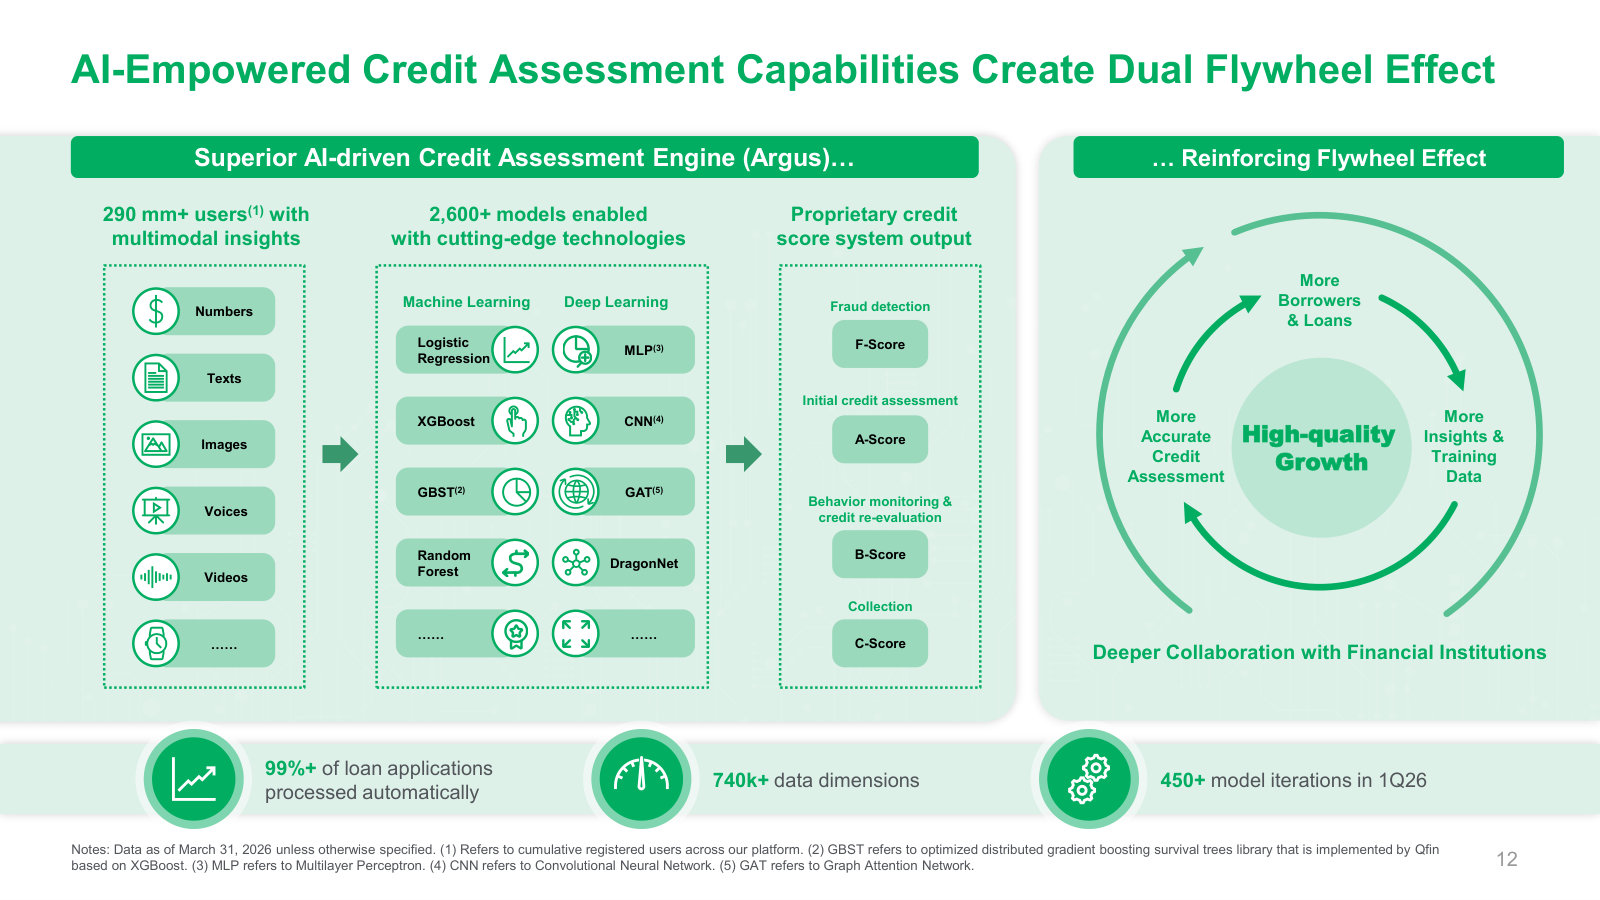
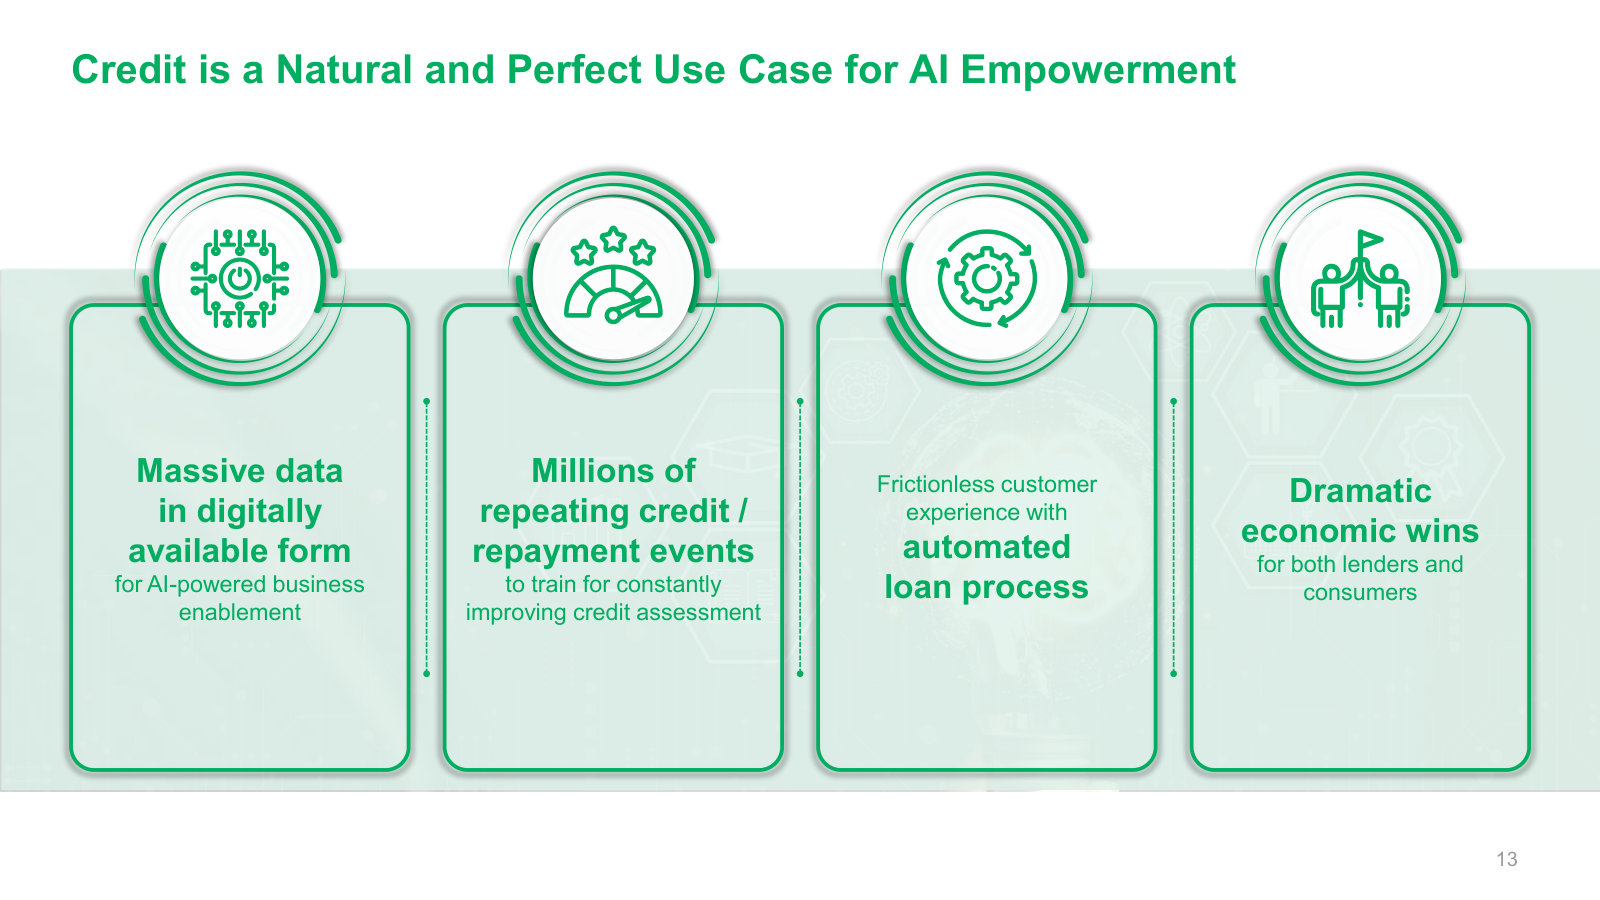
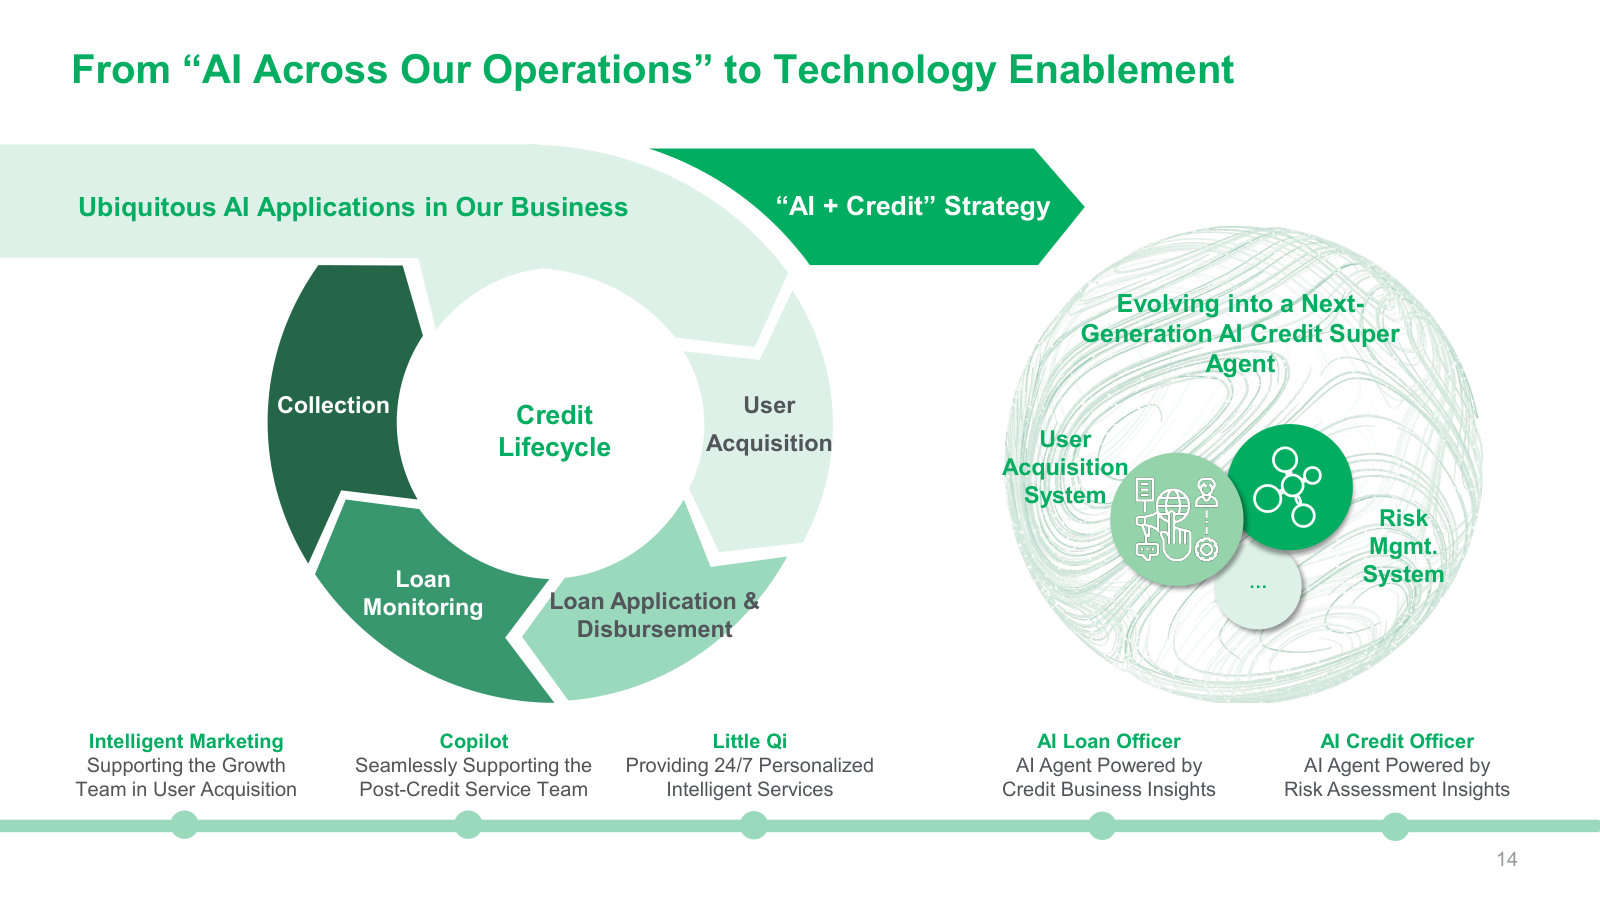
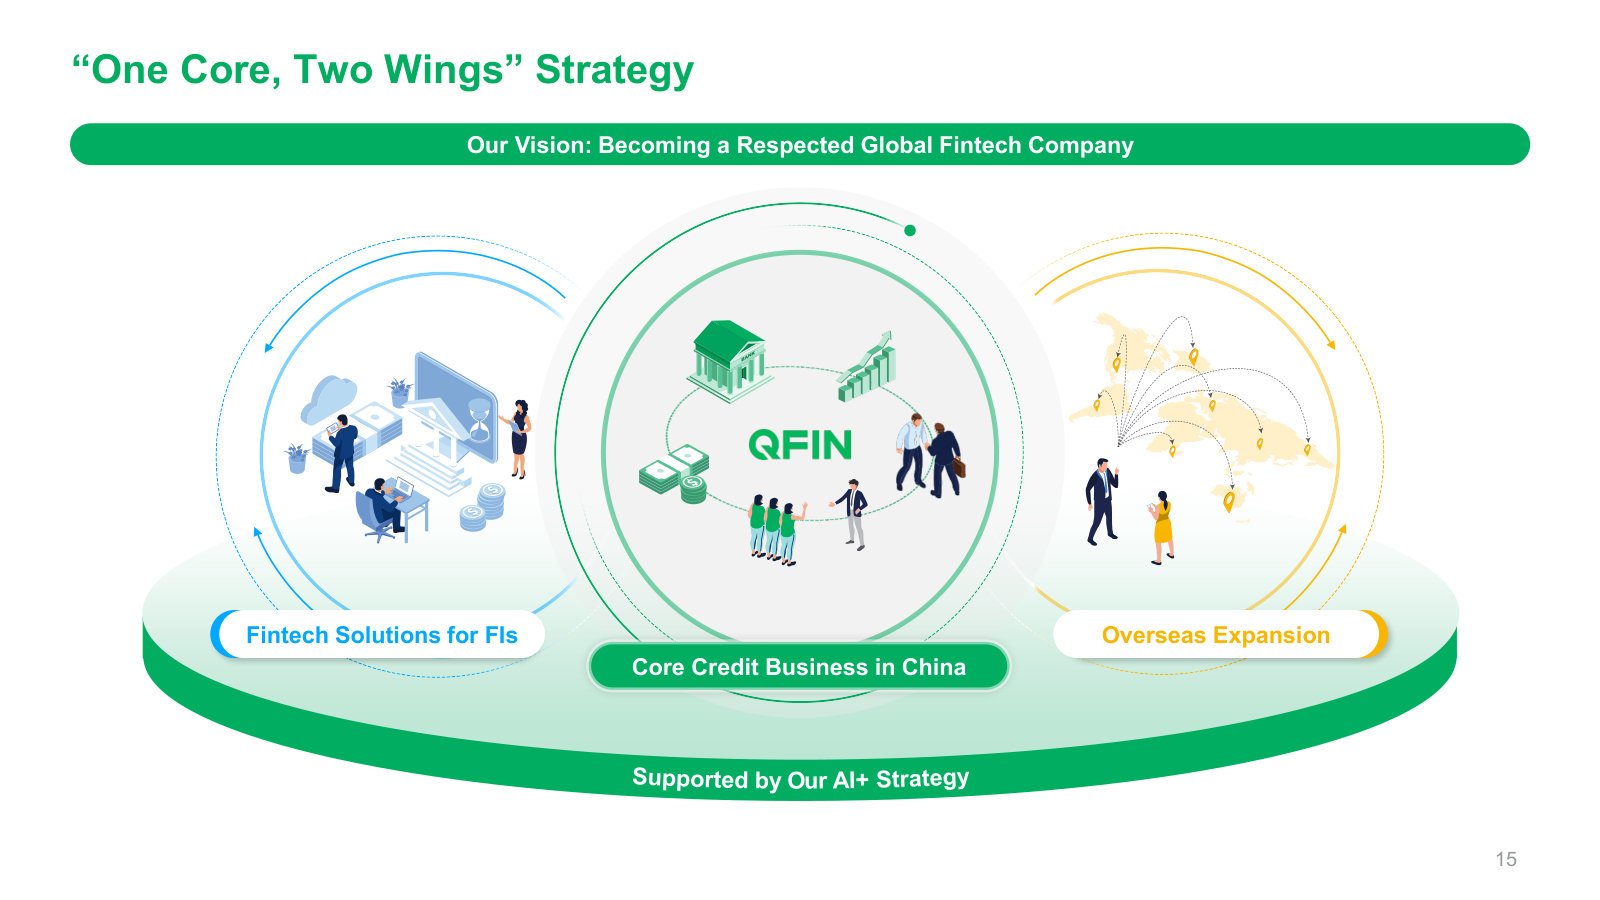
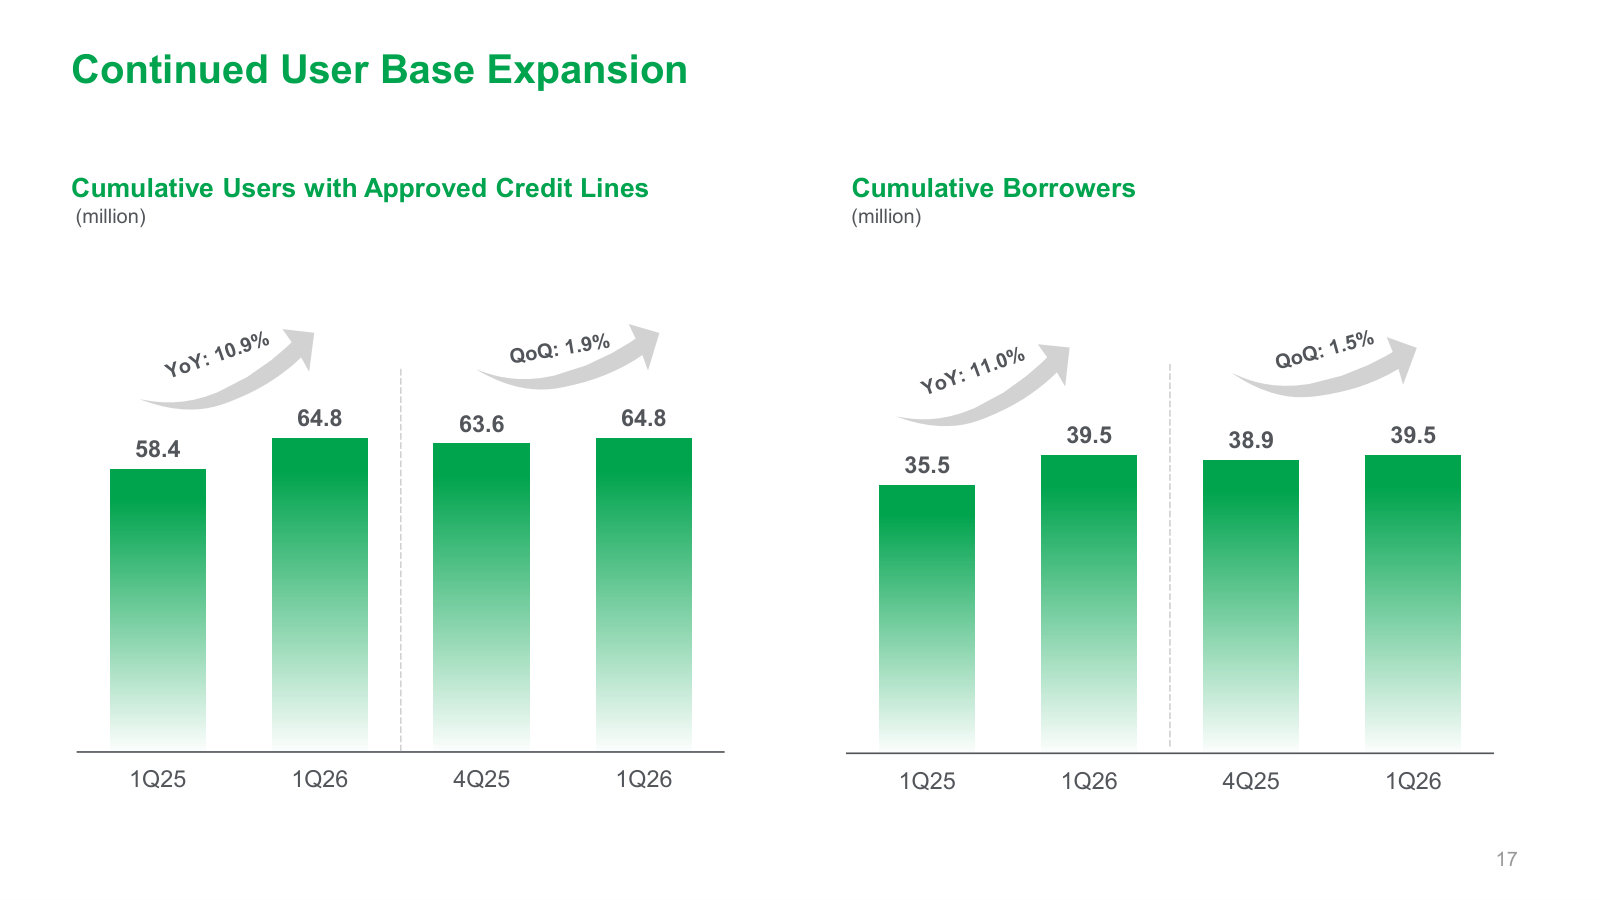
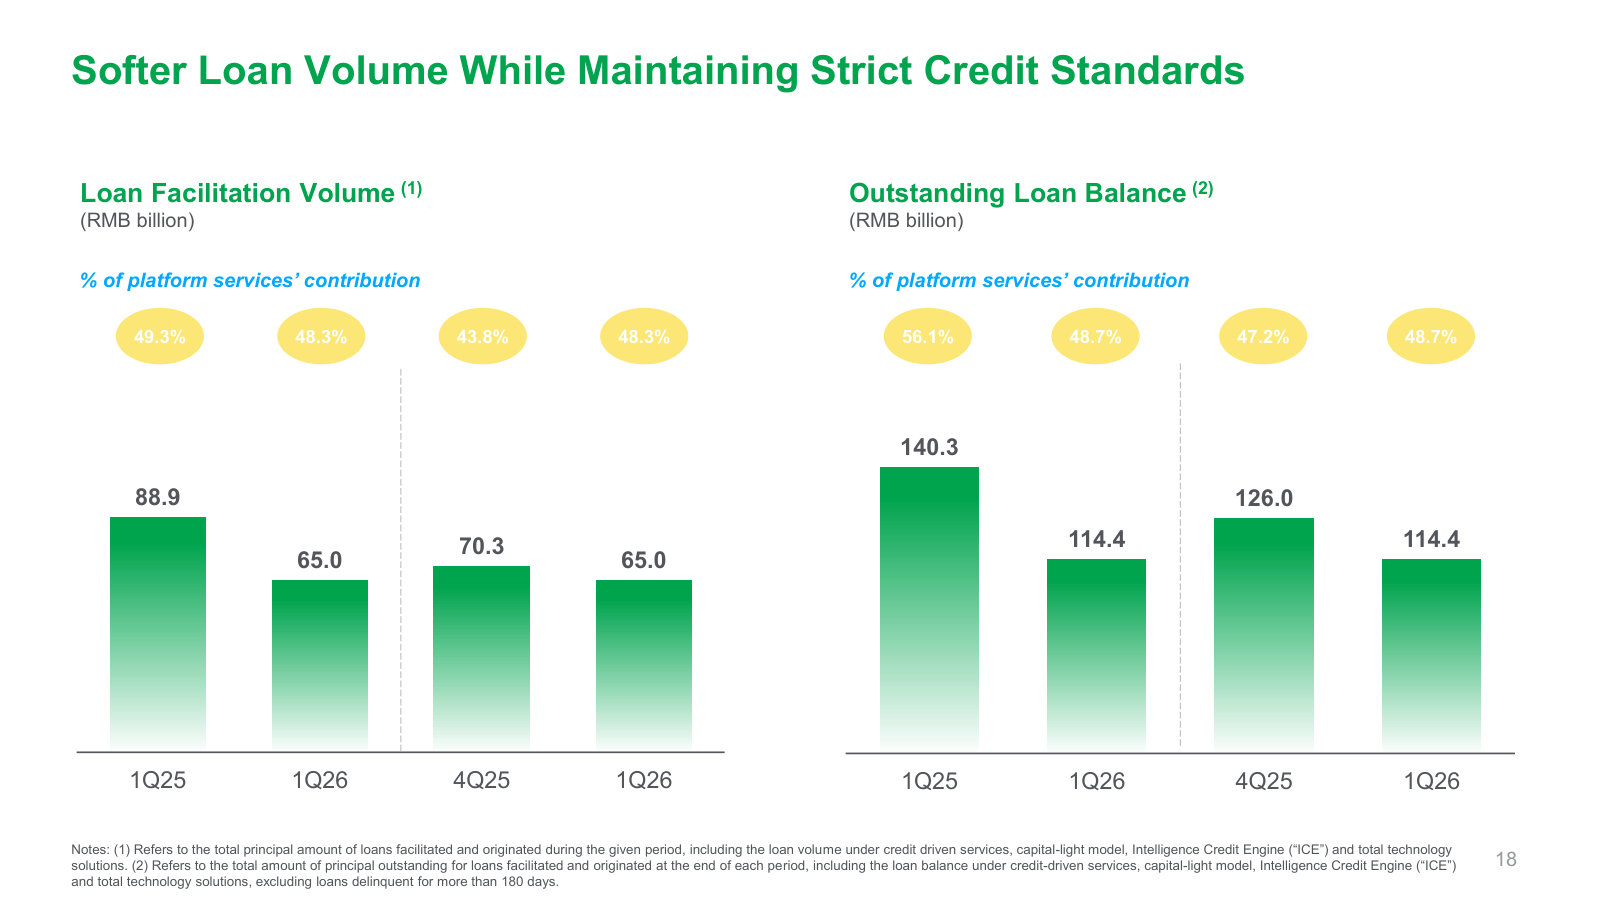
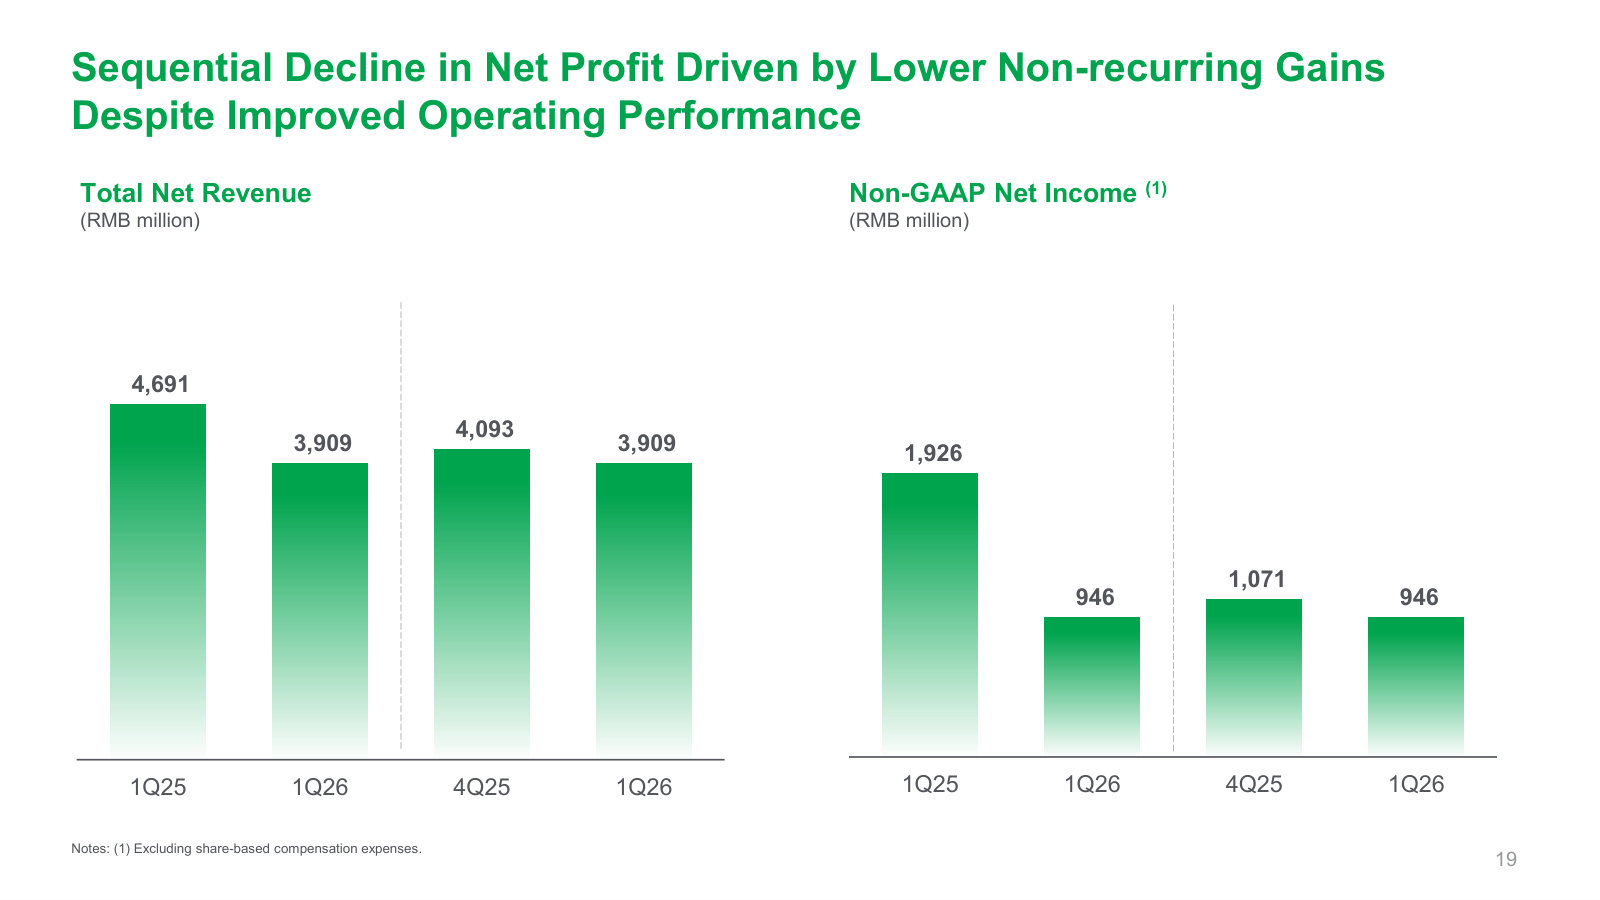
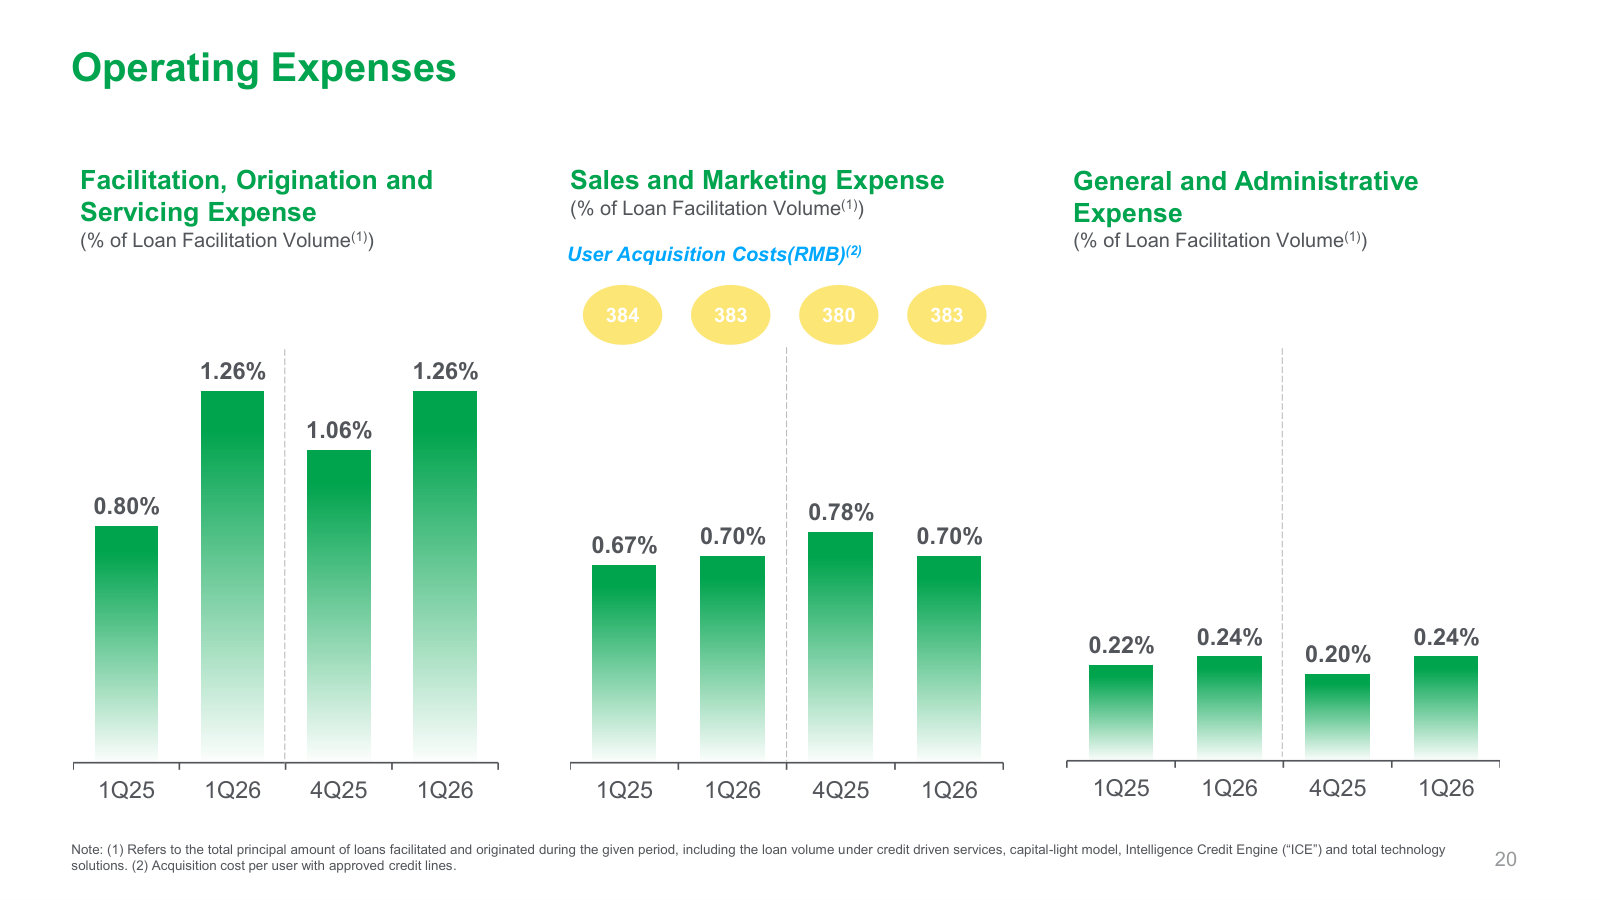
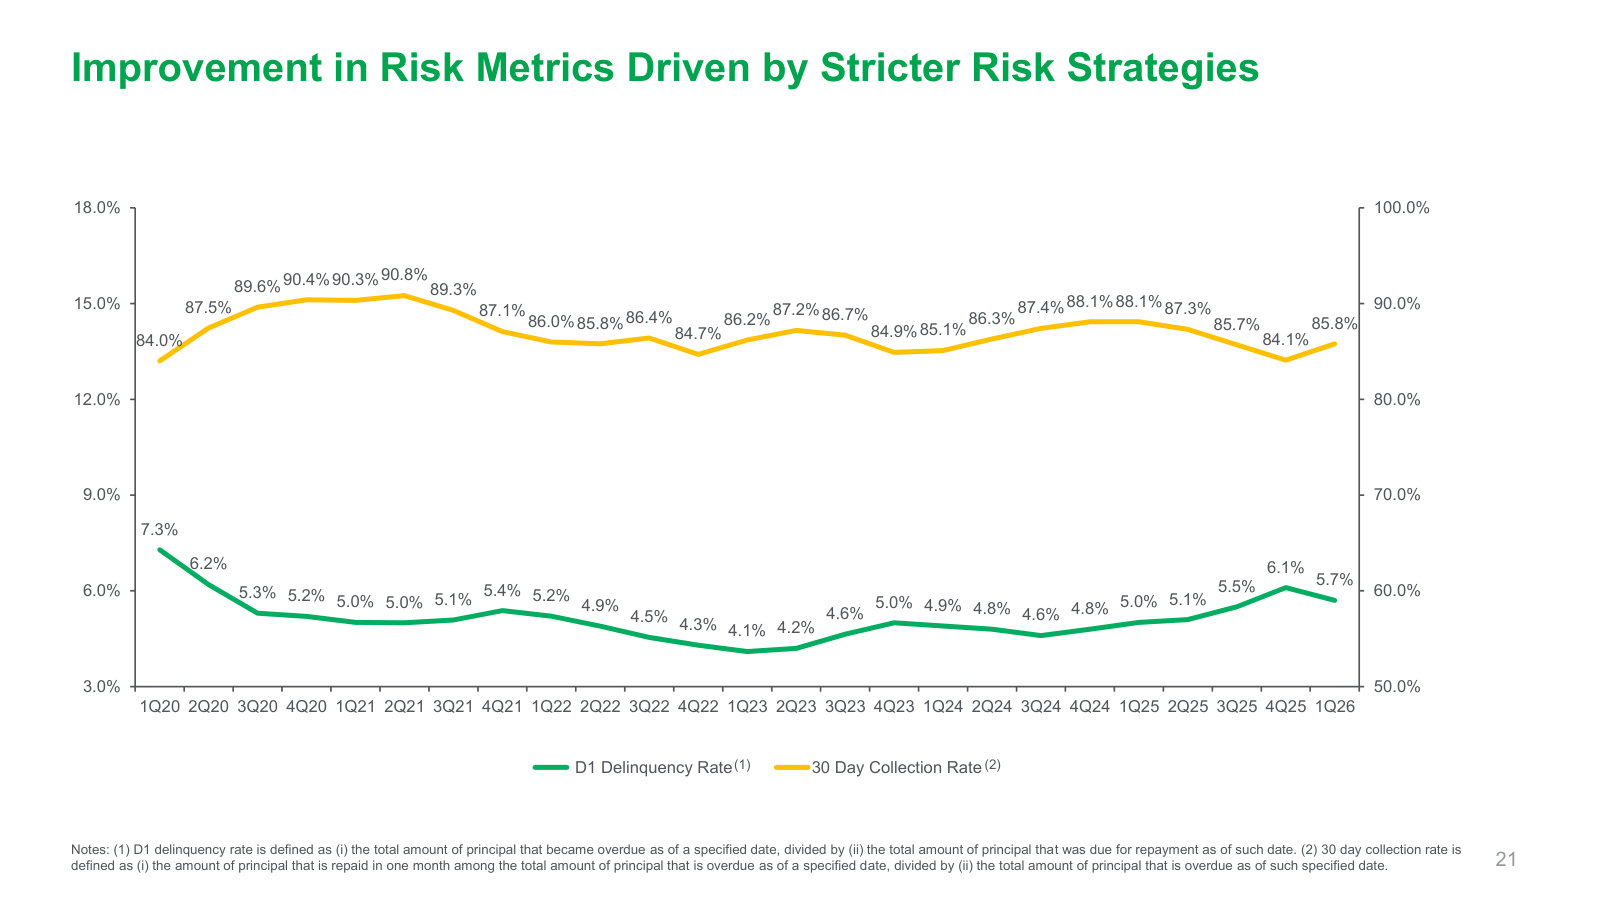
p. 5 — The scale snapshot: 64.8m approved-credit users, 167 institutional funding partners, RMB65bn quarterly loan volume, RMB946m non-GAAP profit, 15.7% ROE. · Open the full presentation →p. 6 — Capital return — US$1.2bn of ADSs bought back cumulatively (28% of the share count) plus a progressive dividend rising to $1.54 per ADS. · Open the full presentation →p. 7 — The business model in one diagram: QFIN sits between borrowers and 167 financial institutions, providing acquisition, credit assessment and post-loan servicing. · Open the full presentation →p. 8 — Who the borrowers are and their unit economics — 65% under 40, RMB12.7k average drawdown, 11.3-month tenor, mostly tier-3/4 cities. · Open the full presentation →p. 9 — How QFIN earns fees: four service models from capital-heavy lending (2016) to capital-light facilitation and pure tech solutions (2020), with the revenue source for each. · Open the full presentation →p. 10 — User acquisition — AI-driven online advertising, 79 embedded-finance channels and offline referral feeding a 64.8m-user / 39.5m-borrower funnel. · Open the full presentation →p. 11 — The track record: loan volume from RMB31bn (2017) to RMB327bn (2025) alongside 180-day delinquency curves by vintage — growth against asset quality. · Open the full presentation →p. 12 — The Argus credit engine — 290m+ user profiles feeding 2,600+ models into fraud/credit/behavior scores, and the data-to-accuracy flywheel it drives. · Open the full presentation →p. 13 — Management's case for why credit is a natural fit for AI: abundant digital data, repeated repayment events, automatable process, clear economic payoff. · Open the full presentation →p. 14 — AI across the credit lifecycle — the tools deployed at each stage and the pivot toward AI-agent products (AI loan officer, AI credit officer). · Open the full presentation →p. 15 — The 'One Core, Two Wings' strategy: China credit at the center, with fintech solutions for institutions and overseas expansion as the two growth wings. · Open the full presentation →p. 17 — User-base growth — cumulative approved-credit users and borrowers, showing the funnel expanding ~11% year over year. · Open the full presentation →p. 18 — Loan volume and outstanding balance easing under tighter credit standards, with the ~48% split between on- and off-balance-sheet (platform) models. · Open the full presentation →p. 19 — Revenue and non-GAAP profit — the sequential dip management attributes to lower one-off gains rather than operating deterioration. · Open the full presentation →p. 20 — The cost structure as a take-rate: facilitation, sales-and-marketing and G&A expense as a percentage of loan volume, plus user-acquisition cost. · Open the full presentation →p. 21 — Asset-quality trend since 2020 — day-one delinquency and 30-day collection rates, the core risk gauges for a credit platform. · Open the full presentation →
4Q2025 Result Presentation — 4Q25 · 22 pages · The prior edition of the same deck, carrying the 4Q25 and full-year 2025 operating and financial figures. · Open →
1Q2025 Result Presentation — 1Q25 · 22 pages · The year-ago edition (issued under the former Qifu Technology name) for a like-for-like comparison of the same metrics. · Open →