Full Report
The numbers behind Qfin Holdings, Inc.: as-reported financial statements and company metrics for FY2021–FY2025, traced to the source filings, opened with the share-price history those statements have to justify. Every linked figure opens the exact page of the filing it was printed on, with the statement row highlighted. Amounts in RMB thousands (¥000) unless noted.
Reading notes: All figures are consolidated, in thousands of Renminbi (RMB) exactly as printed in the Form 20-F statements (the filings also print a USD convenience column for the latest year only, which is not used here). The company reports in RMB (CNY); the structured data feed (data/financials/.json, source yfinance:QFIN) is mislabeled 'USD' but its values are RMB. The tab uses the filings' RMB figures. Earnings per share are stated per ADS (1 ADS = 2 ordinary shares), as printed in each statement's 'Net income per ADS' line; share counts are the weighted-average diluted ORDINARY shares as printed. Entity was named 360 DigiTech, Inc. (FY2021 20-F), then Qifu Technology, Inc. (FY2022–FY2023 20-Fs), now Qfin Holdings, Inc. (FY2025 20-F); statement structure is continuous across the name changes.*
Share Price — Available History Since January 2026
The stock closed at $13.38 on Jul 27, 2026 — down 16% over the window shown, trading between $11.65 and $16.91.
Source: market price feed, daily closes, Jan 2026–Jul 2026 — the feed marks this available history as partial. Price return only, excludes dividends.
FY2025 at a Glance
Revenue (RMB thousands (¥000))
Net income (RMB thousands (¥000))
Diluted EPS
Source: FY2025 consolidated statements [1] [2]. Click any linked figure to open the filing page with the row highlighted.
Total Net Revenue by Service Line
| Total Net Revenue by Service Line | FY2021 | FY2022 | FY2023 | FY2024 | FY2025 |
|---|---|---|---|---|---|
| Credit driven services | 10,189,167 | 11,586,251 | 11,738,560 | 11,719,027 | 13,977,218 |
| Loan facilitation and servicing fees-capital heavy | 2,326,027 | 2,086,414 | 1,667,119 | 1,016,514 | 1,604,903 |
| Financing income | 2,184,128 | 3,487,951 | 5,109,921 | 6,636,511 | 8,569,063 |
| Revenue from releasing of guarantee liabilities | 5,583,135 | 5,899,153 | 4,745,898 | 3,695,017 | 3,412,952 |
| Other services fees (credit-driven) | 95,877 | 112,733 | 215,622 | 370,985 | 390,300 |
| Platform services | 6,446,478 | 4,967,679 | 4,551,467 | 5,446,629 | 5,227,841 |
| Loan facilitation and servicing fees-capital light | 5,677,941 | 4,124,726 | 3,213,955 | 2,116,797 | 1,162,563 |
| Referral services fees | 620,317 | 561,372 | 950,016 | 2,842,637 | 2,738,786 |
| Other services fees (platform) | 148,220 | 281,581 | 387,496 | 487,195 | 1,326,492 |
| Total net revenue | 16,635,645 | 16,553,930 | 16,290,027 | 17,165,656 | 19,205,059 |
| Total net revenue growth, derived | — | -0.5% | -1.6% | +5.4% | +11.9% |
Source: Consolidated Statements of Operations (revenue disaggregation), Form 20-F [1] [2]. Click any linked figure to open the filing page with the row highlighted.
Income Statement
Source: Consolidated Statements of Operations, Form 20-F [1] [2]. Click any linked figure to open the filing page with the row highlighted.
Columns marked E are consensus analyst estimates from S&P Capital IQ (CapIQ), shown alongside reported results for direct comparison; they are not company guidance.
Estimate source: S&P Capital IQ (CapIQ) consensus, as of 2026-07-27. Estimate figures are S&P Capital IQ consensus (vendor data — no filing page links). EPS and net income use the normalized (adjusted) consensus where the street reports it. Consensus revenue sits well below the as-reported line for the last actual year — analysts often model a narrower revenue basis (e.g. net of interest or pass-through costs), so compare trends, not levels. Line-item analyst models (segments, drivers, KPIs) are in the Visible Alpha tab.
Balance Sheet
| Balance Sheet | FY2021 | FY2022 | FY2023 | FY2024 | FY2025 |
|---|---|---|---|---|---|
| Cash and cash equivalents | 6,116,360 | 7,165,584 | 4,177,890 | 4,452,416 | 4,696,817 |
| Restricted cash | 2,643,587 | 3,346,779 | 3,381,107 | 2,353,384 | 2,844,101 |
| Short term investments | 0 | 57,000 | 15,000 | 3,394,073 | 2,852,254 |
| Loans receivable, net (current) | 9,844,481 | 15,347,662 | 24,604,487 | 26,714,428 | 34,680,954 |
| Total current assets | 27,757,223 | 34,097,466 | 39,796,028 | 42,780,568 | 49,481,458 |
| Total assets | 33,504,995 | 40,343,170 | 45,818,572 | 48,132,618 | 56,949,795 |
| Short term loans | 397,576 | 150,000 | 798,586 | 1,369,939 | 1,202,891 |
| Total liabilities | 18,288,386 | 21,411,873 | 23,808,715 | 23,886,399 | 32,792,752 |
| Total equity | 15,216,609 | 18,931,297 | 22,009,857 | 24,246,219 | 24,157,043 |
Source: Consolidated Balance Sheets, Form 20-F [3] [4] [5]. Click any linked figure to open the filing page with the row highlighted.
Cash Flow
| Cash Flow | FY2021 | FY2022 | FY2023 | FY2024 | FY2025 |
|---|---|---|---|---|---|
| Net cash provided by operating activities | 5,789,700 | 5,922,515 | 7,118,350 | 9,343,311 | 11,083,748 |
| Purchase of property, equipment and intangible assets | (25,307) | (26,973) | (84,554) | (153,150) | (240,542) |
| Net cash used in investing activities | (6,064,328) | (7,355,975) | (11,147,789) | (7,994,081) | (13,082,044) |
| Stock repurchase | 0 | 0 | (636,179) | (2,973,192) | (4,848,116) |
| Dividend to shareholders | 0 | (988,586) | (941,705) | (1,262,935) | (1,378,103) |
| Net cash provided by (used in) financing activities | 2,263,720 | 3,204,068 | 1,066,458 | (2,114,463) | 2,783,865 |
| Net (decrease) increase in cash and cash equivalents | 1,985,681 | 1,752,416 | (2,953,366) | (753,197) | 735,118 |
| Free cash flow, derived | 5,764,393 | 5,895,542 | 7,033,796 | 9,190,161 | 10,843,206 |
Source: Consolidated Statements of Cash Flows, Form 20-F [6] [7]. Click any linked figure to open the filing page with the row highlighted.
Loan Volume and User Engagement
| Loan Volume and User Engagement | FY2021 | FY2022 | FY2023 | FY2024 | FY2025 |
|---|---|---|---|---|---|
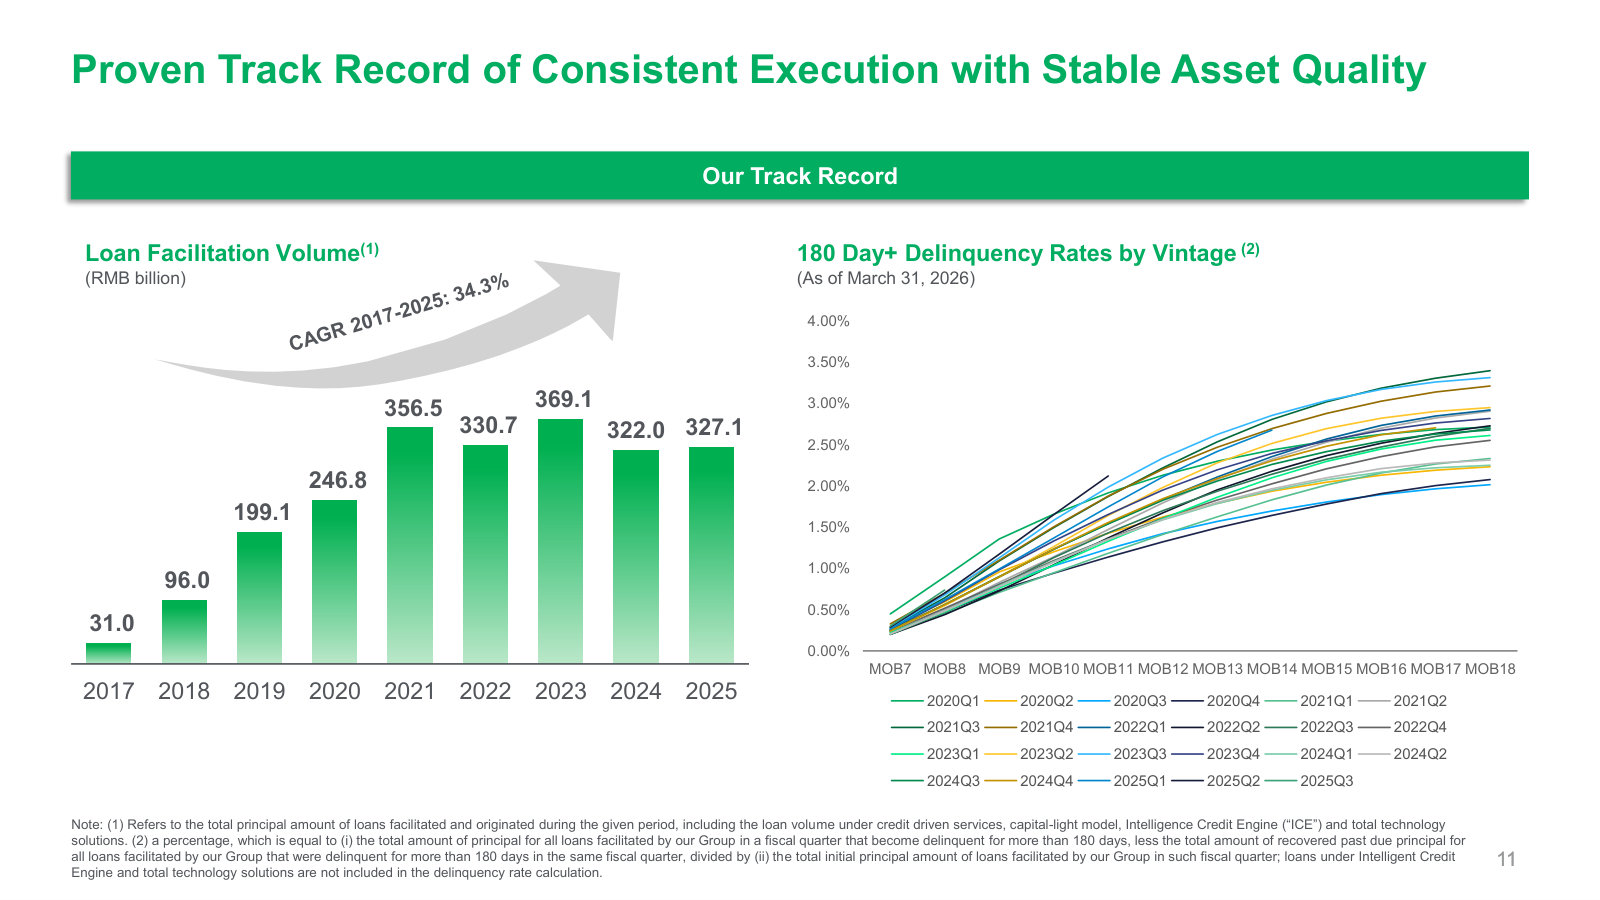
| Total loan facilitation volume | — | 330,700,000 | 369,100,000 | 322,000,000 | 327,100,000 |
| Platform-services share of loan facilitation volume | — | — | 44.5% | 53.0% | 44.1% |
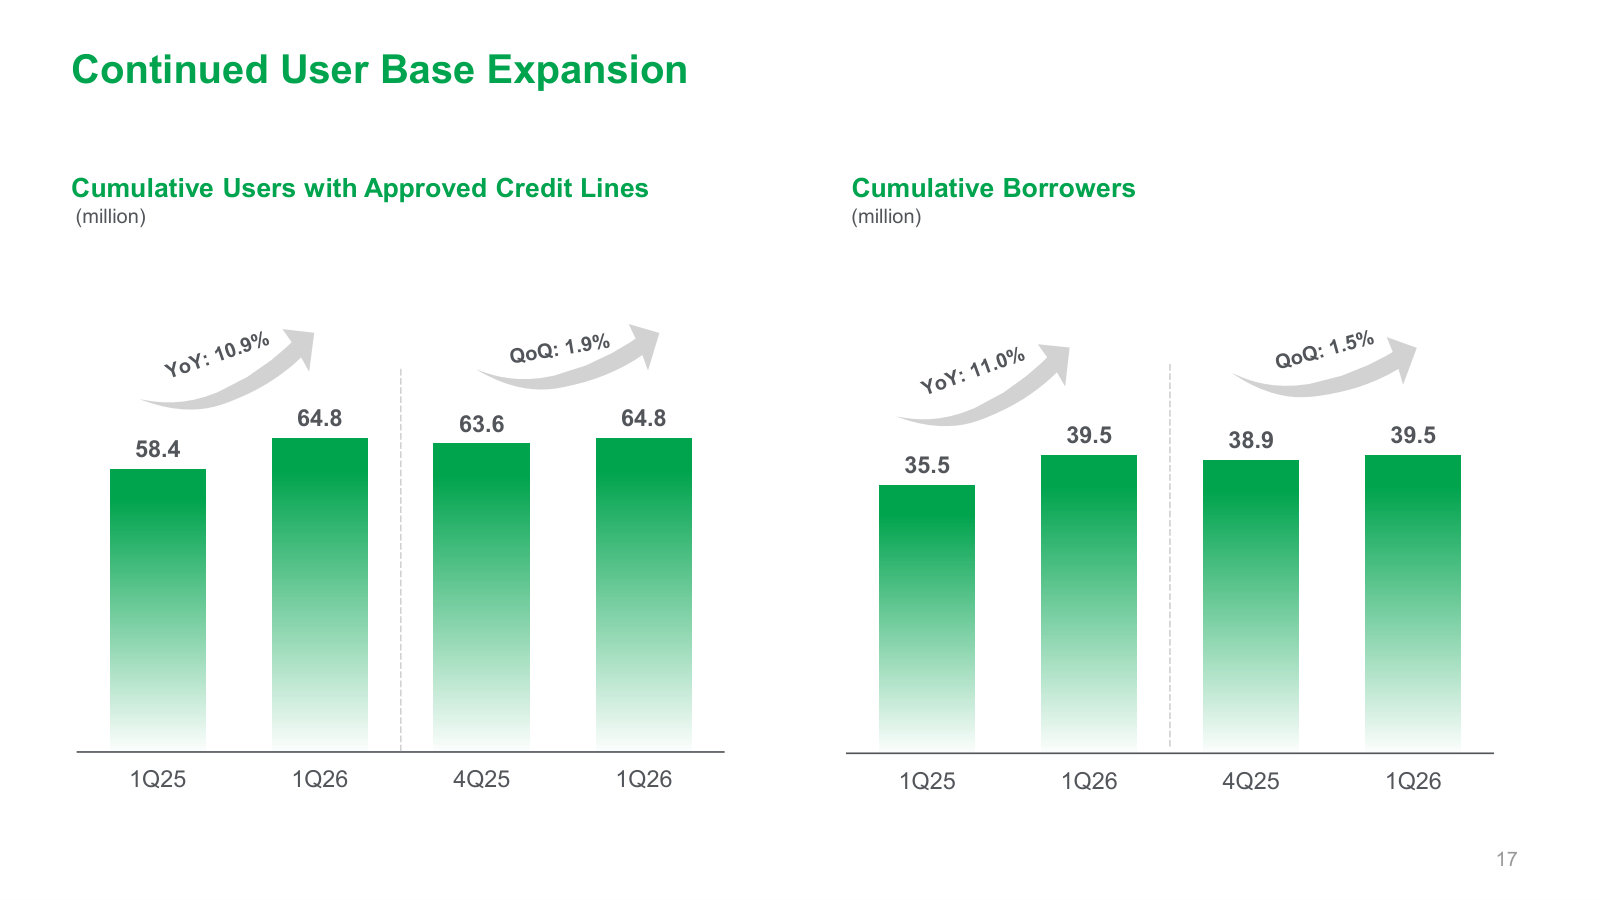
| Users with approved credit lines | 38,500,000 | 44,500,000 | 50,900,000 | 56,900,000 | 63,600,000 |
| Repeat borrower contribution | — | 88.7% | 91.6% | 93.1% | 93.3% |
| Weighted average contractual tenor (months) | — | 11.7 | 11.2 | 10.1 | 10.5 |
Source: company filings [8] [9] [10] [11]. Click any linked figure to open the filing page with the row highlighted.
Loan Book and Capital Intensity
| Loan Book and Capital Intensity | FY2021 | FY2022 | FY2023 | FY2024 | FY2025 |
|---|---|---|---|---|---|
| Total outstanding loan balance | — | — | 145,270,000 | 137,014,000 | 126,012,000 |
| On-balance sheet loans outstanding | — | — | 29,257,000 | 31,866,000 | 42,863,000 |
| Off-balance sheet loans outstanding | — | — | 116,013,000 | 105,148,000 | 83,149,000 |
| On-balance sheet share of outstanding loans | — | — | 20.1% | 23.3% | 34.0% |
Source: company filings [12]. Click any linked figure to open the filing page with the row highlighted.
Funding and Credit Quality
| Funding and Credit Quality | FY2021 | FY2022 | FY2023 | FY2024 | FY2025 |
|---|---|---|---|---|---|
| Financial institution partners (cumulative) | 119 | 143 | 157 | 162 | 167 |
| Cumulative ABS / ABN issued | 10,500,000 | 18,500,000 | 31,000,000 | 46,200,000 | 67,600,000 |
| 90 day+ delinquency rate | 1.5% | 2.0% | 2.4% | 2.1% | 2.7% |
Source: company filings [13] [8] [14] [15]. Click any linked figure to open the filing page with the row highlighted.
Long-Term Record
| Fiscal year | Total net revenue | Income from operations | Net income | Diluted earnings per ADS | Net cash provided by operating activities |
|---|---|---|---|---|---|
| FY2019 | 9,219,847 | 2,893,591 | 2,501,304 | 16.62 | 2,973,075 |
| FY2020 | 13,563,954 | 3,790,158 | 3,495,709 | 22.80 | 5,325,810 |
| FY2021 | 16,635,645 | 6,786,199 | 5,764,513 | 35.98 | 5,789,700 |
| FY2022 | 16,553,930 | 4,472,184 | 4,005,568 | 25.00 | 5,922,515 |
| FY2023 | 16,290,027 | 4,856,964 | 4,268,577 | 26.08 | 7,118,350 |
| FY2024 | 17,165,656 | 7,528,570 | 6,248,116 | 41.28 | 9,343,311 |
| FY2025 | 19,205,059 | 6,678,419 | 5,975,643 | 44.02 | 11,083,748 |
Source: consolidated statements across filings; older years from the standardized feed [6] [1] [2] [16]. Click any linked figure to open the filing page with the row highlighted.
Analyst Consensus
Mean target
Median target
High target
Low target
Street ratings: 7 strong buy, 4 buy, 2 hold. Consensus: Buy.
Estimate source: S&P Capital IQ (CapIQ) consensus, as of 2026-07-27. Estimate figures are S&P Capital IQ consensus (vendor data — no filing page links). EPS and net income use the normalized (adjusted) consensus where the street reports it. Consensus revenue sits well below the as-reported line for the last actual year — analysts often model a narrower revenue basis (e.g. net of interest or pass-through costs), so compare trends, not levels. Line-item analyst models (segments, drivers, KPIs) are in the Visible Alpha tab.
Traceability
289 of 312 figures on this page (93%) link to the filing page where they are printed — click a linked figure to open the source PDF at that page with the row highlighted. Unlinked figures come from standardized data feeds or pre-filing years.
All figures are consolidated, in thousands of Renminbi (RMB) exactly as printed in the Form 20-F statements (the filings also print a USD convenience column for the latest year only, which is not used here).
The company reports in RMB (CNY); the structured data feed (data/financials/*.json, source yfinance:QFIN) is mislabeled 'USD' but its values are RMB. The tab uses the filings' RMB figures.
Earnings per share are stated per ADS (1 ADS = 2 ordinary shares), as printed in each statement's 'Net income per ADS' line; share counts are the weighted-average diluted ORDINARY shares as printed.
Entity was named 360 DigiTech, Inc. (FY2021 20-F), then Qifu Technology, Inc. (FY2022–FY2023 20-Fs), now Qfin Holdings, Inc. (FY2025 20-F); statement structure is continuous across the name changes.
FY2021–FY2022 columns are cited from the FY2023 Form 20-F; FY2023–FY2025 from the FY2025 Form 20-F; FY2019–FY2020 (long-term record) from the FY2021 Form 20-F. Balance-sheet FY2021 is cited from the FY2022 Form 20-F.
Operating KPIs are disclosed but omitted from this statements-scale tab to avoid unit mixing: total loan facilitation and origination volume was RMB369.1bn / RMB322.0bn / RMB327.1bn in 2023/2024/2025, with total outstanding platform loan balance of RMB126.0bn at Dec 31, 2025 (FY2025 20-F).
Stock repurchase and dividends began in 2022–2023 (nil in FY2021); those nil cells are shown as 0 without a citation.
Quarterly block shows single-quarter income statements as printed in each quarter's unaudited results press release (Q1 FY2025 through Q1 FY2026); Q1–Q4 FY2025 single quarters sum to the FY2025 audited totals.
2 figure(s) differed between the data feed and the filing; the filing value is shown (see the run's metrics/metrics_tab.json for the audit trail).
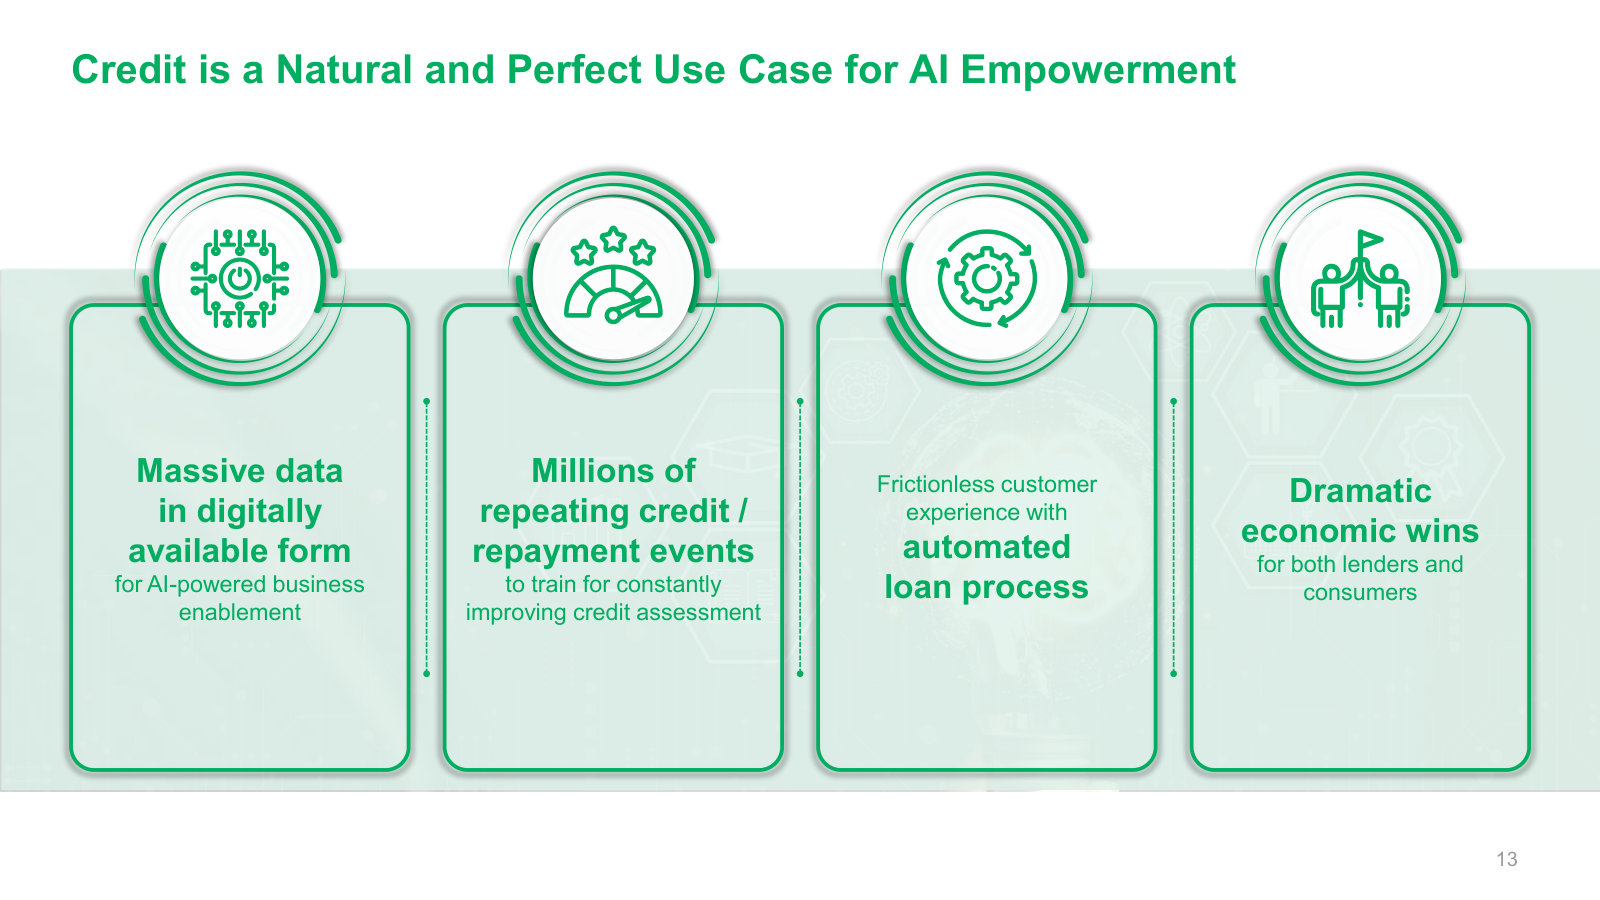
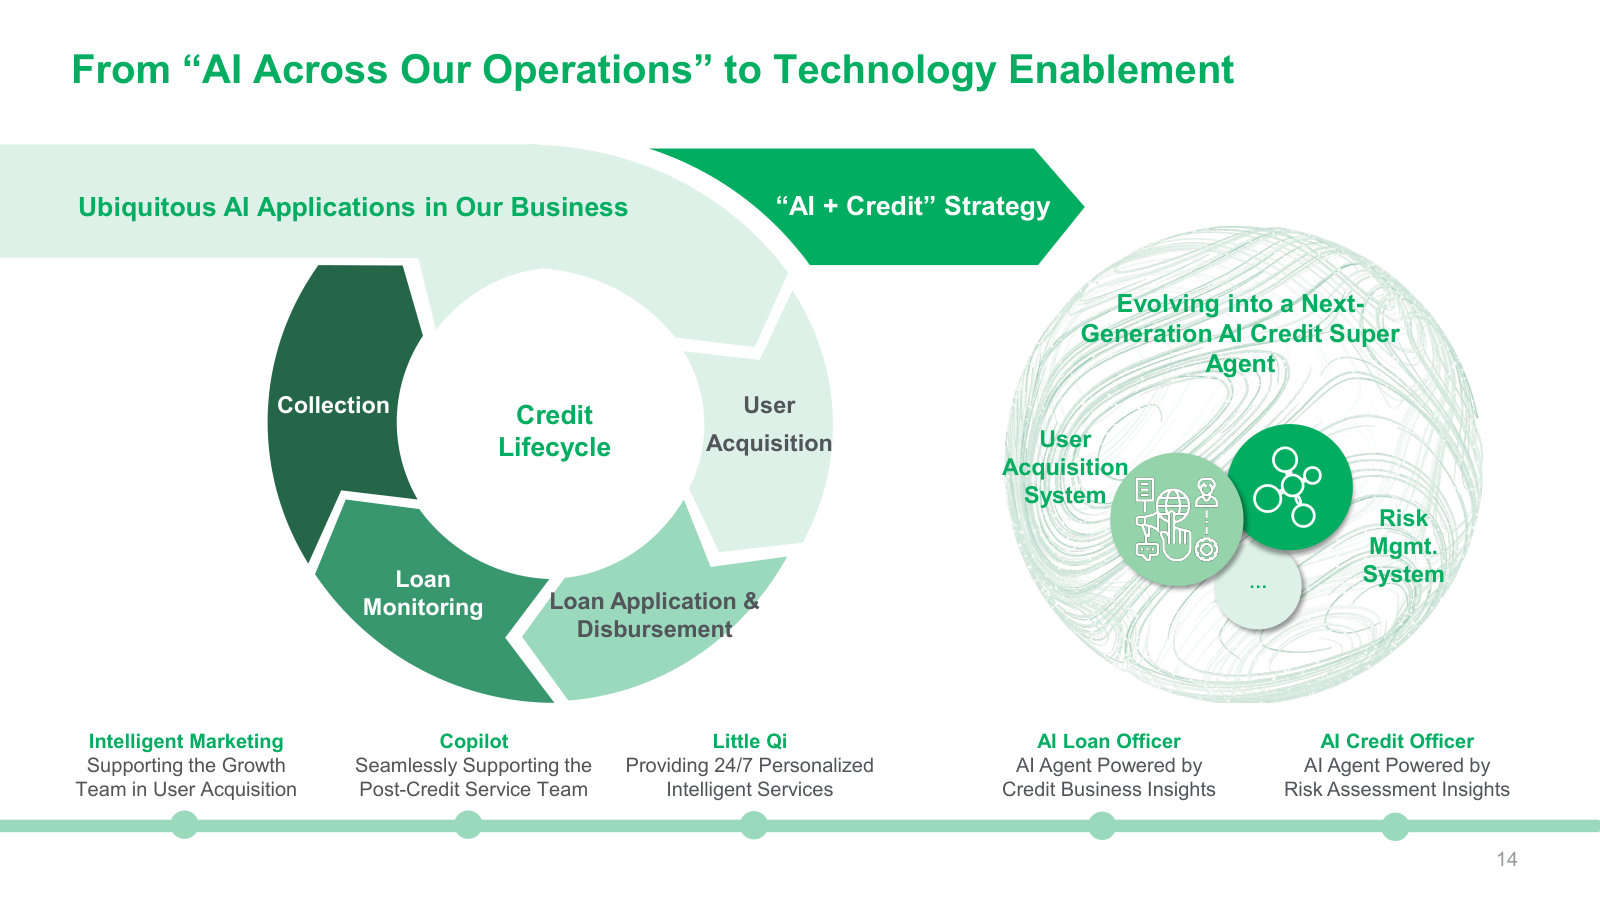
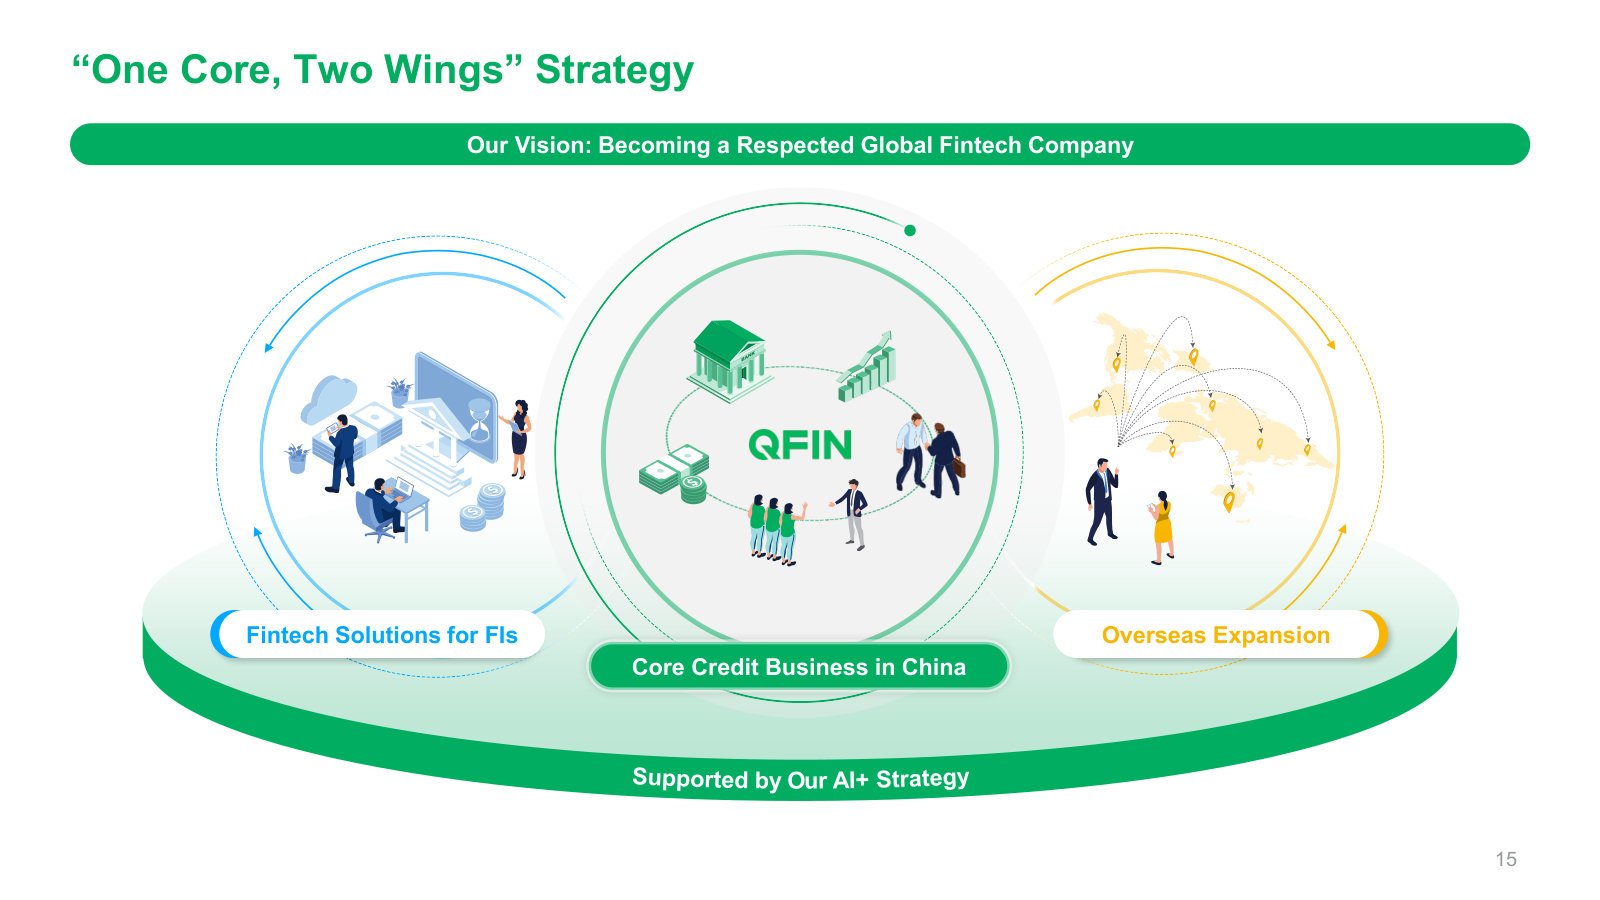
Qfin Holdings, Inc.'s management explains the business in its own materials. The slides below do the most of that work, pulled from the documents preserved in Sources. Each source link opens the complete presentation at that slide in a new tab.
1Q2026 Result Presentation — 1Q26
The current investor-overview deck: how the platform makes money, its business models, AI engine, strategy, and the latest operating data — the fastest zero-to-understanding read on QFIN. · Open the full document →
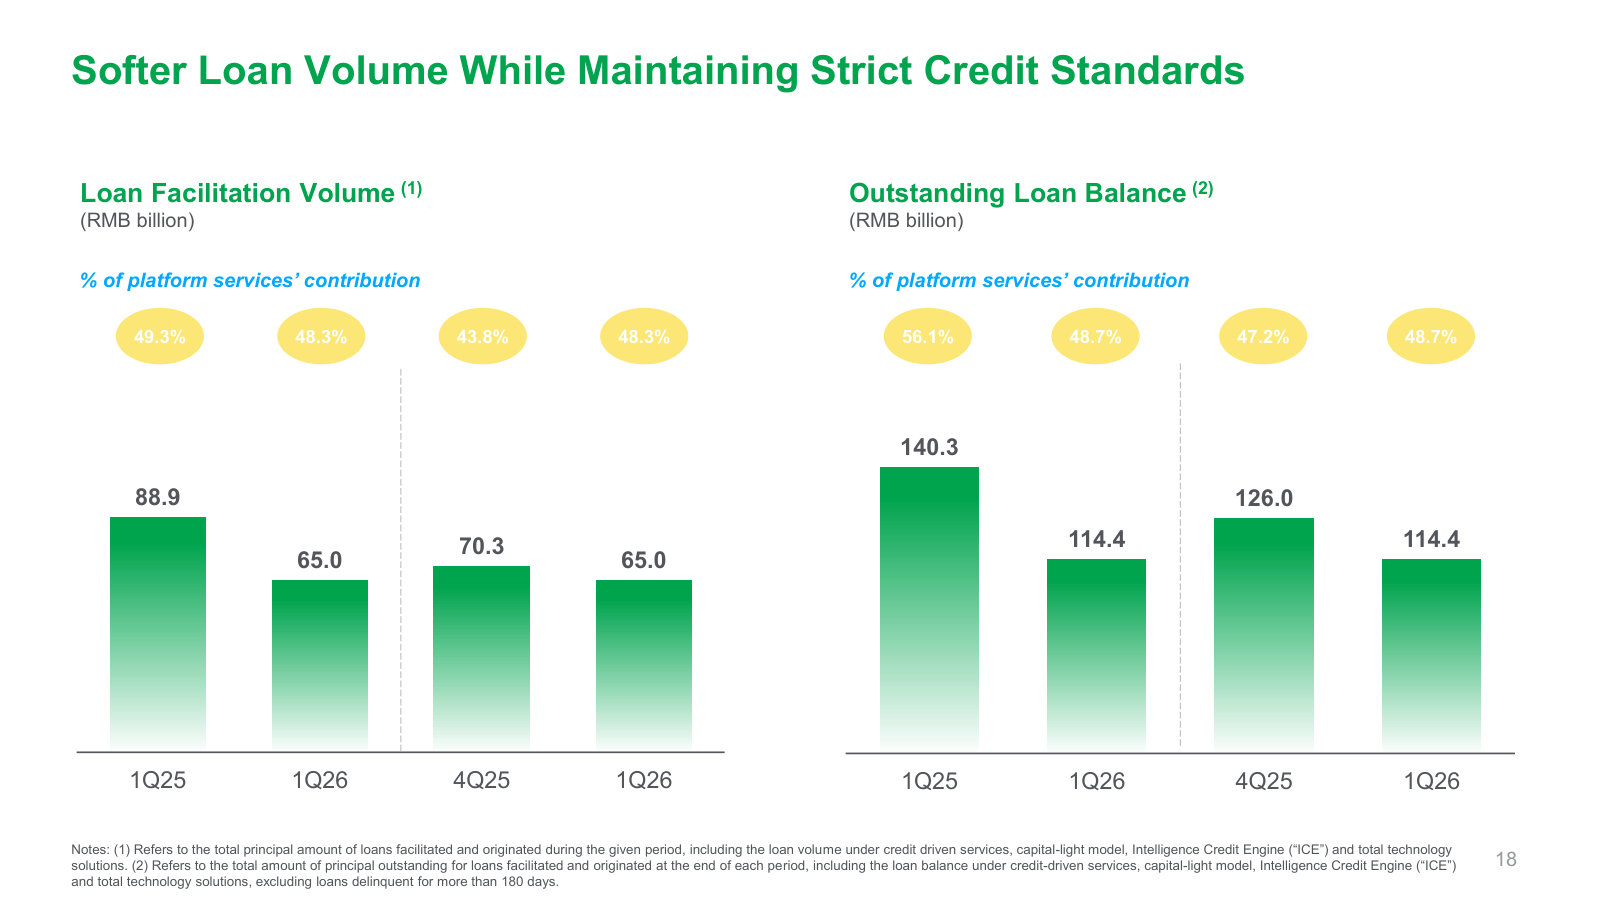
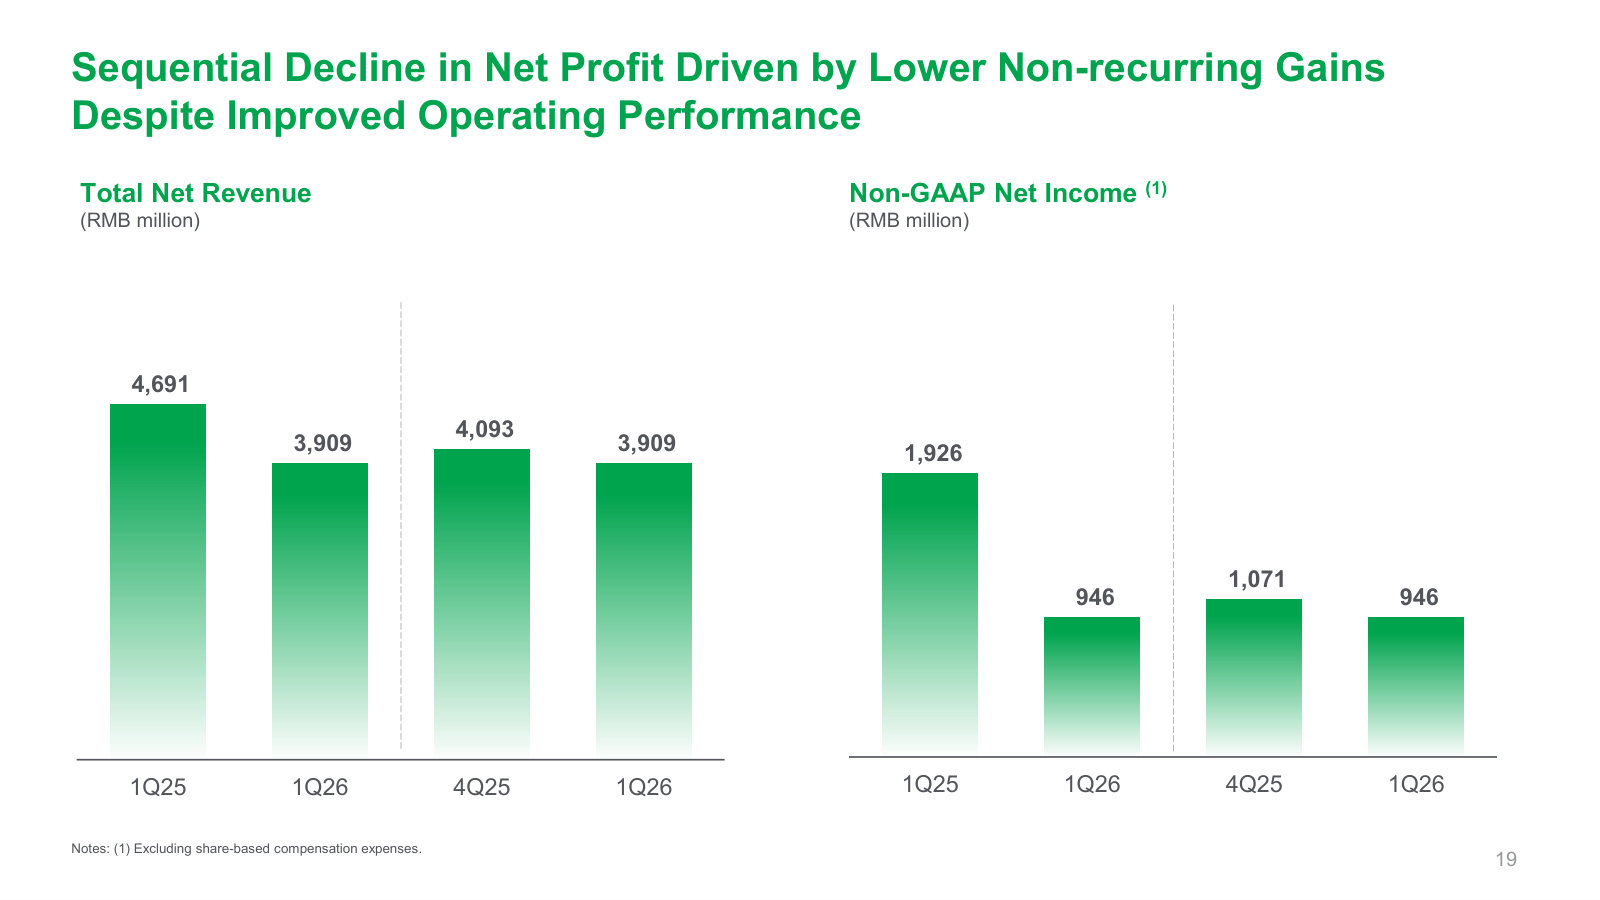
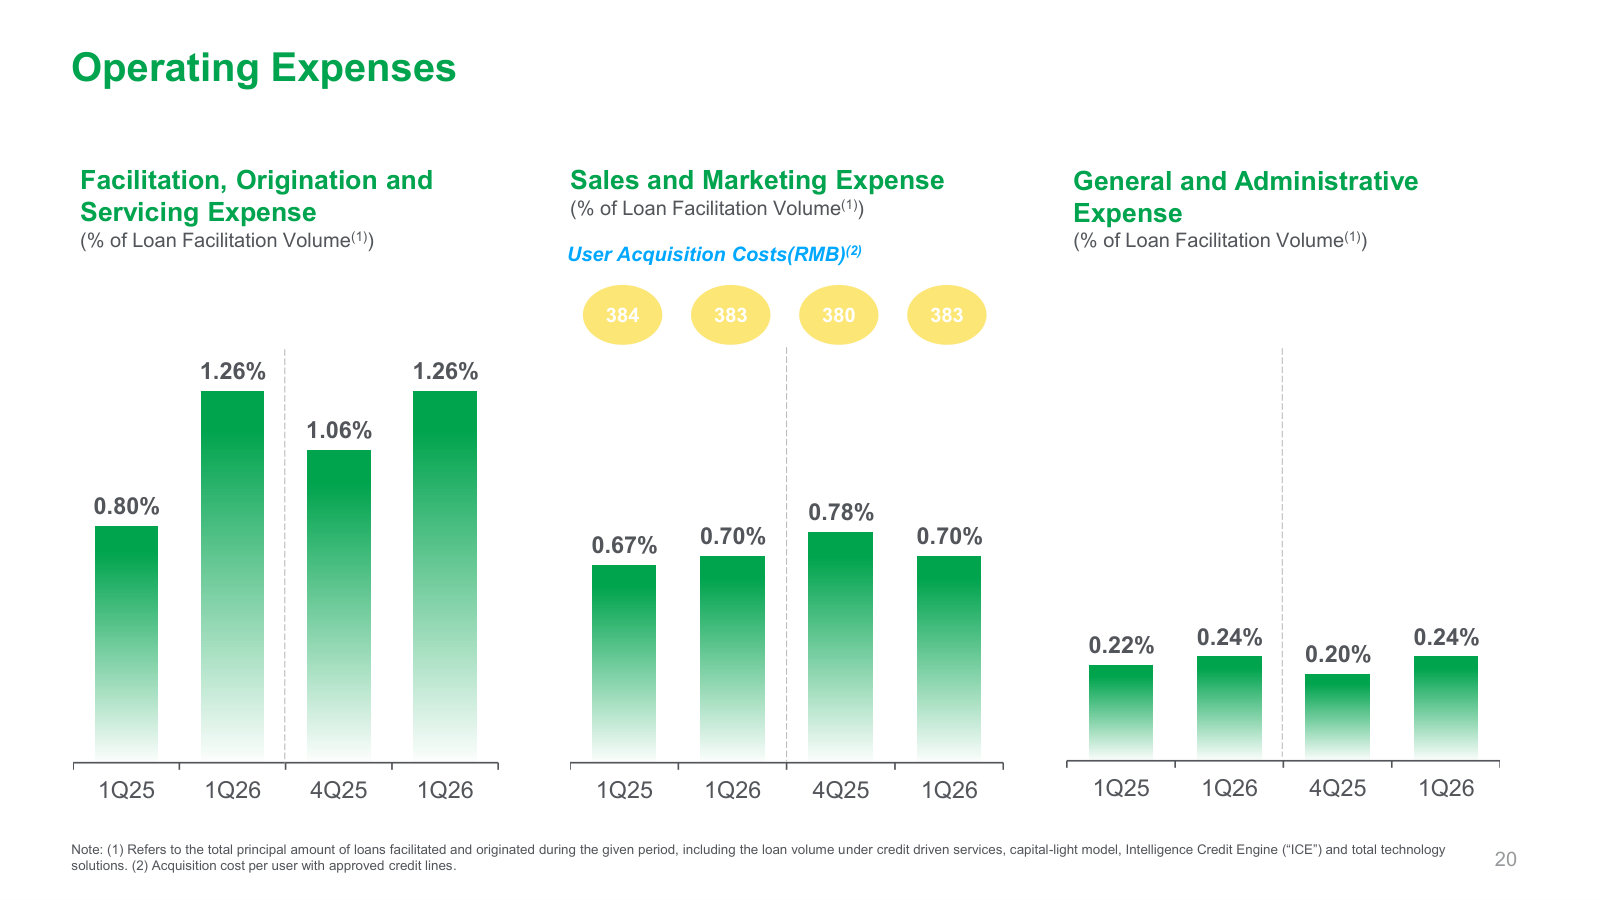
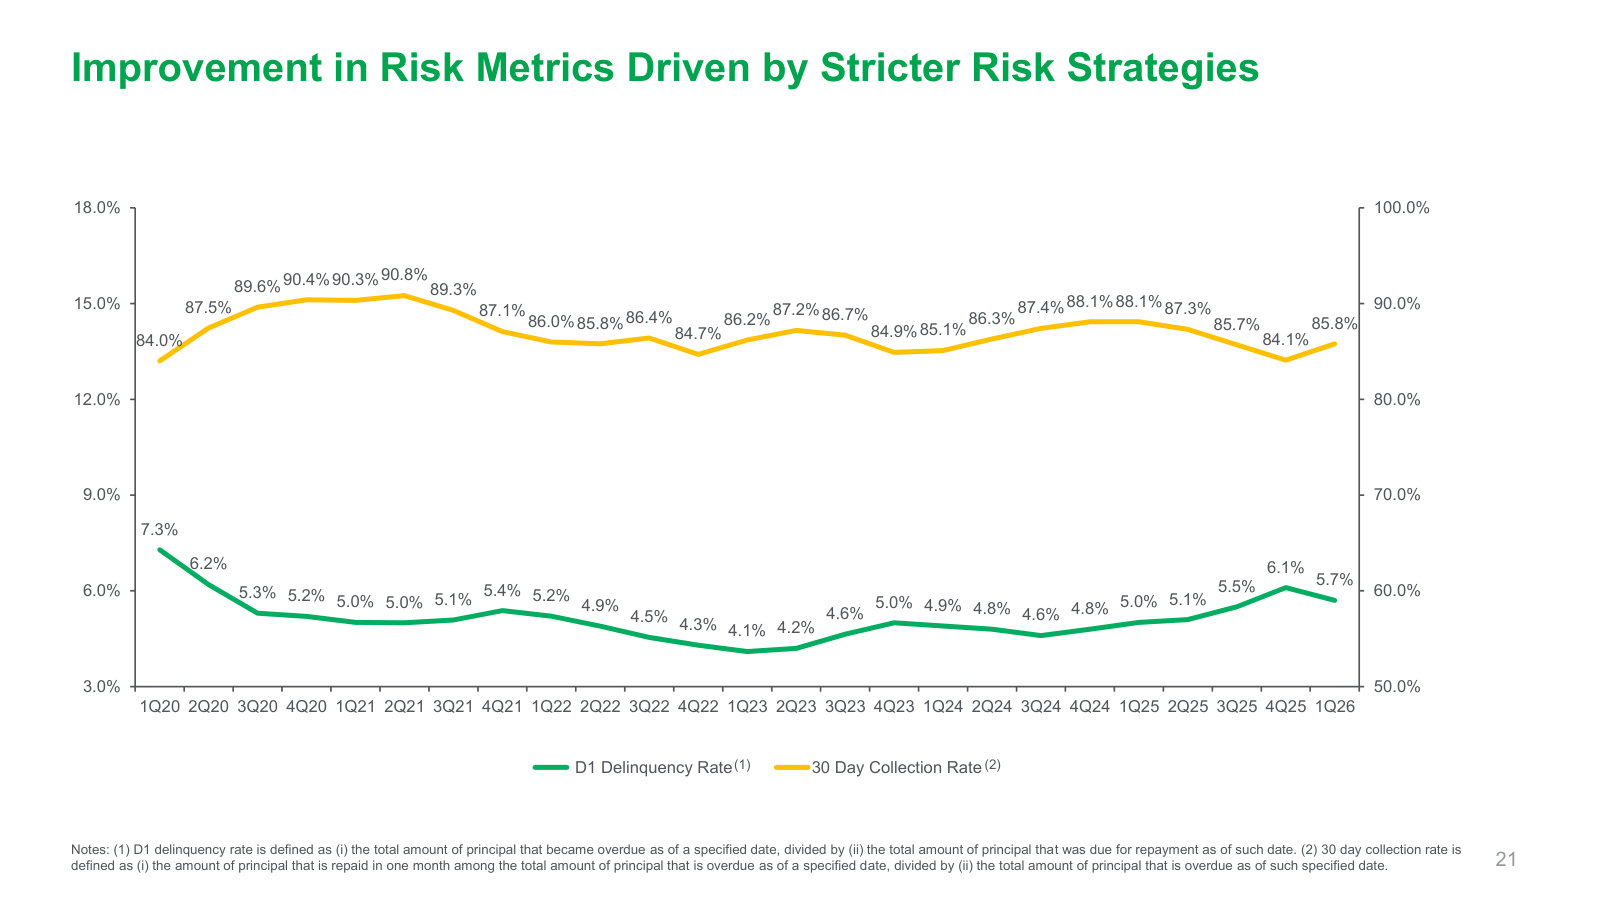
More from management
4Q2025 Result Presentation — 4Q25 · 22 pages · The prior edition of the same deck, carrying the 4Q25 and full-year 2025 operating and financial figures. · Open →
1Q2025 Result Presentation — 1Q25 · 22 pages · The year-ago edition (issued under the former Qifu Technology name) for a like-for-like comparison of the same metrics. · Open →
Qfin Holdings, Inc.'s management answers for the business every quarter. These are the exchanges that explain it best — verbatim, from the call transcripts preserved in Sources. Each link opens the full transcript at that page in a new tab.
Q1 2026 Earnings Call — Q1 2026
The current playbook: with China's consumer-credit market shrinking for a fifth straight quarter, management explains the deliberate retreat to high-quality, lower-priced borrowers, the fast-growing capital-light tech business, and how it returns capital through a downturn. · Open the full transcript →
The market QFIN is lending into: household short-term consumer loan balances fell for a fifth straight quarter.
Haisheng Wu (CEO): Demand for consumer credit remained soft, and asset quality faced broad based pressure. Household short term consumer loan balances declined for the fifth consecutive quarter. Decreasing by approximately RMB470 billion or 5% sequentially.
p. 5 · Read in context →
The capital-light future: a tech-solutions business serving banks priced at 3-12% grew sevenfold year on year.
Haisheng Wu (CEO): Turning to our tech solutions business. We have continued to deepen collaboration with financial institutions and actively cultivate our enterprise facing technology offerings. As another long term strategic pillar. […] Supporting banks in serving customer segments priced between 3% and 12%. At this stage, we are focused on validating these capabilities at scale. Which will lay a solid foundation for long term commercialization opportunities ahead. In Q1, loan volumes empowered by our tech solutions business reached RMB9.96 billion, representing 7- fold year over year growth. This demonstrates that our tech driven capital light model is steadily gaining industry recognition and being validated across multiple use cases.
p. 8 · Read in context →
How QFIN books revenue: capital-heavy credit-driven versus capital-light platform, and how regulation gutted the ICE line.
Zuoli "Alex" Xu (CFO): Total net revenue for Q1 was RMB3.91 billion versus RMB4.09 billion in Q4 and RMB4.69 billion a year ago. Revenue from credit-driven service, Capital-Heavy, RMB2.96 billion. In Q1 compared to RMB3.43 billion in Q4 and RMB3.11 billion a year ago. […] Revenue from platform services, Capital-Light, was RMB951.9 million in Q1, compared to RMB660 million in Q4 and RMB1.58 billion a year ago. The year on year decline was mainly due to significantly lower ICE contribution in response to the regulatory changes.
p. 10 · Read in context →
Why pricing keeps falling: a deliberate trade of near-term profit for stickier, higher-LTV prime users.
Haisheng Wu (CEO), responding to Richard Xu (Morgan Stanley): we also optimized pricing for our existing users with better risk profile. By giving them more competitive offers, we intended to increase their stickiness on our platform. […] As a result of these efforts, our average pricing was down 80 basis points sequentially. […] Strengthening our capabilities to serve high quality users is a longterm play. […] In the short term, it requires investment. But in substance, it is a trade-off between near term profit and long term sustainable value.
p. 14 · Read in context →
Capital-return philosophy in a downturn: dividends for certainty, buybacks when the price is right.
Zuoli "Alex" Xu (CFO): In terms of shareholder returns, our balance sheet is still pretty robust, and we have strong capital base to support both the business growth and the shareholder returns. At the same time, our business continue to generate substantial profit and healthy positive cash flow which steadily build up our capital base. Both dividend and the buybacks are considered as options for us. At this stage, we see dividend as a way to give shareholders certainty in uncertain environment.
p. 15 · Read in context →
The unit-economics discipline: CAC 'is just a number' - every dollar judged on payback, LTV and per-loan ROI.
Haisheng Wu (CEO): And I want to emphasize that customer acquisition cost is just a number. Which is heavily impacted by channels and acquisition mix. Therefore, we do not simply chase a low absolute CAC. Instead, for every dollar we spend, we track payback period. the user LTV, and measure eficiency based on ROI.
p. 19 · Read in context →
Q4 2024 Earnings Call — Q4 2024
The victory-lap FY2024 call: record profit and a 27.9% ROE from the shift to a capital-light platform, an unusually candid AI roadmap, and the fullest statement of the buyback-plus-dividend return policy. · Open the full transcript →
The platform-model shift paying off: record FY2024 profit, ~12% of shares repurchased, a 27.9% ROE.
Haisheng Wu (CEO): As our business model gradually shifts to a platform model, our organizational capabilities have been upgraded alongside it. […] In 2024, with our take rate continuing to improve, full-year non-GAAP net income rose 44% year-over-year to reach an all-time high of RMB6.42 billion. Additionally, we successfully executed USD410 million share repurchase buying back approximately 12% of our share count at the beginning of the year. […] our ROE for 2024 increased further to 27.9%, significantly outperforming most financial services and Internet companies in China.
p. 2 · Read in context →
The return framework in full: a new $450M buyback to accrete EPADS, plus a semiannually rising dividend.
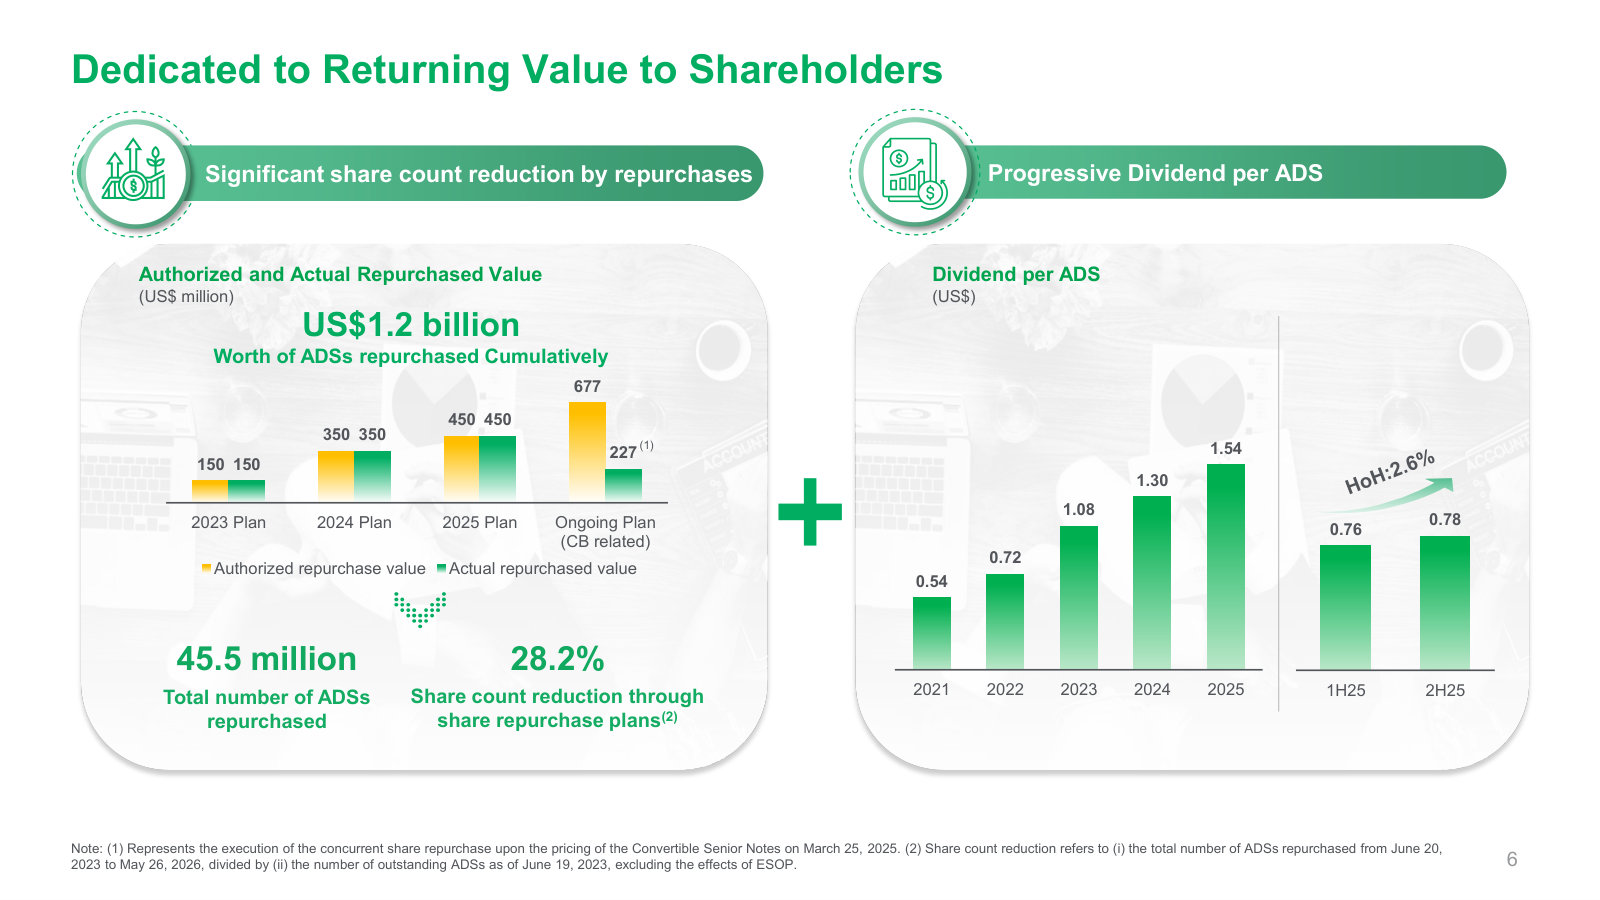
Zuoli "Alex" Xu (CFO): Board of Directors approved a new share repurchase plan to buy back up to USD450 million worth of ADS over a 12-month period starting January 1, 2025. […] the management intend to further use share repurchase to accelerate EPADS accretion. […] We intend to gradually increase the dividend per ADS on a semiannual basis.
p. 9 · Read in context →
Where AI actually earns its keep: collection (Capella at ~84% adoption), fraud detection, and end-to-end credit decisioning.
Haisheng Wu (CEO), answering Richard Xu (Morgan Stanley): We believe credit is perfect scenario for AI application because this industry has a strong data foundation and a high degree of digitalization. […] So far, the adoption rate of the Capella system among our collecting team has reached about 84%. […] This year, we will put a more portion of our traffic into the end-to-end AI-driven risk decision-making process. We are really looking forward to the results of this test.
p. 10 · Read in context →
Risk-appetite philosophy: not chasing the lowest possible loss rate when take-rate cushion allows experimentation.
Yan Zheng (CRO): I also want to emphasize that we are not aiming to reduce our risk to the absolute lowest level as it doesn’t serve the best interest of the company. Right now, with a decent level of take rate we have a solid margin opportunity to experiment with new strategies and find a better balance between growth and risk.
p. 12 · Read in context →
The take-rate engine: net take rate approaching 6%, with cushion to 'test around the margin' for extra profit.
Zuoli "Alex" Xu (CFO): by the end of last year, in Q4, our take rate net approach to 6%. […] we have enough sort of cushion in our take rate, all our risk metrics that enable us to actually do a little bit testing around the margin.
p. 12 · Read in context →
Q4 2023 Earnings Call — Q4 2023
The clearest teardown of how the platform makes money: the ICE asset-allocation model and its 54% take-rate jump, the capital-light vs capital-heavy split, and the pivot to prioritise efficiency over scale after 2023's macro and telecom-line-control shocks. · Open the full transcript →
The strategic turn to 'efficiency over scale,' and the embedded-finance channel as sole fintech partner on a short-video giant.
Haisheng Wu (CEO): After thorough consideration by management, we have set quality growth and profitability as our primary objectives and shifted our operational strategy to prioritize efficiency over scale. […] Starting in July, we began working with a leading short-form video platform as their only fintech partner through our embedded finance model. […] In 2023, the percentage of new users with approved credit lines through the embedded finance channel rose to 31% with 82% increase in loan facilitation and origination volume.
p. 3 · Read in context →
How the platform makes money: matching loan assets to each bank's risk appetite lifted the ICE take rate 54% year on year.
Haisheng Wu (CEO): By aligning assets based on the risk appetites of different institutions, we optimized our asset allocation and increased overall returns on our loan portfolio. […] In 2023, our loan facilitation and origination volume under the ICE model steadily increased. The enhanced precision in asset allocation increased the underwriting efficiency from financial institution partners, resulting in a notable improvement in our take rate. In Q4, our revenue take rate as percentage of loan volume for ICE improved by 54% from the same period last year.
p. 4 · Read in context →
The 2023 asset-quality scare - telecom carriers' line controls - and the credit-tightening response.
Haisheng Wu (CEO): In the second half of the year, we encountered notable volatility in our asset quality due to the broader macro headwinds. The stricter line controls by China’s telecom carriers in Q4 added further pressure to our overall risk profile. In response to these challenges, starting in Q3, we have gradually tightened our credit standards and iterated risk strategies across the loan facilitation, credit operation, and post credit process to improve our risk metrics.
p. 4 · Read in context →
The two-engine model defined: capital-light already ~57% of volume, blended IRR trimmed to 21.3%.
Zuoli "Alex" Xu (CFO): For Q4, capital-light loan facilitation, ICE and other tech solution combined account for roughly 57% of the total loan volume compared to roughly 56% in the prior quarter. We expect this ratio to be gradually trending up through 2024 as we try to strike an optimal mix between riskbearing and non-risk bearing assets in an uncertain macro environment. […] During the quarter, average IRR of the loans we originated and/or facilitated was 21.3% compared to 21.7% in the prior quarter, as we purposely trimmed our direct exposure to high-price, high-risk assets in response to the macro uncertainty.
p. 7 · Read in context →
Guidance philosophy, tested by Morgan Stanley: loan-volume growth is 'not our primary goal' - quality of earnings is.
Haisheng Wu (CEO), responding to Richard Xu (Morgan Stanley): given the macro uncertainties at this stage, we will continue to maintain prudent approach in our operations at least in the first half of 2024. Therefore, the overall loan volume growth is not our primary goal. Instead, our primary goal will be the quality of our growth and the quality of earnings.
p. 11 · Read in context →
Q3 2021 Earnings Call — Q3 2021
The reset call: as China's 24% rate cap and internet-finance crackdown hit, management laid out the capital-light pivot, the quarter-by-quarter price step-down, and a quantified 2022 stress test - the origin of the model QFIN runs today. · Open the full transcript →
The birth of the capital-light thesis: capital-light and tech solutions already ~57% of loan volume.
Zuoli "Alex" Xu (CFO): robust growth was mainly driven by continued progress we have made in capital-light and other technology solutions. During the quarter, capital-light and other tech solution contribute roughly 57% of total loan volume and capital-light facilitation revenue take rate also improved nicely.
p. 8 · Read in context →
The 24% rate cap arrives: pricing to step down ~1 point a quarter through mid-2022, with profitability defended.
Zuoli "Alex" Xu (CFO): During the quarter, average pricing was 26.1% compared to 27.2% in Q2 and 25.9% a year ago. As the 24% rate cap being implemented across the industry, gradually, we are expecting average pricing to trend down by about 1 percentage point each quarter through mid-2022 to satisfy the rate cap requirement. As we discussed in the past, even under a more restrictive and a steep rate cut scenario, we should still be able to maintain healthy growth and profitability in the transitional year of 2022 and resume to a more robust growth afterwards.
p. 8 · Read in context →
An early move upmarket - RMB150-200k-ticket prime users vs the RMB10k regular average, the same pivot seen in 2026.
Zuoli "Alex" Xu (CFO): During the quarter, we continue to maintain healthy pace of customer acquisition, while focusing on attracting high quality borrowers. In particular, we significantly increased the number of customers with much larger credit line and relatively low risk. The average ticket size of these type of customers typically runs between RMB150,000 to RMB200,000 compared to the average of RMB10,000 for regular borrowers.
p. 8 · Read in context →
The hardest question answered: sub-24% assets carry a take rate ~1 point below the 3% book, but better early risk.
Haisheng Wu (CEO), answering Richard Xu (Morgan Stanley): the asset below 24%, it's 1% lower than our current total loan book, which is 3% net take rate. […] as for the risk profile of this 24% cap asset, what we observe is in Q3, the new transaction has better risk performance than the existing asset. For example, in the day one delinquency result metrics, the new transaction is 4.2% and the total loan book is 5.1%.
p. 11 · Read in context →
Management's own downside case: a 24%-cap stress test assuming 20% volume growth and net take rate falling from 4% to 3%.
Zuoli "Alex" Xu (CFO), responding to Thomas Chong (Jefferies): But if you recall, after the second quarter, we did the stress test, which related to the 24% rate cap. […] we assume a 20% kind of volume growth for next year and then the net take rate, as I mentioned early in this call, will come down from 4% right now to about 3% in that stress test. So that assumption as well as the conclusion for that stress test still hold at this point, although I just want to emphasize again, this is not a oficial guidance.
p. 19 · Read in context →
More calls
Q4 2025 Earnings Call — Q4 2025 · 25 pages · The FY2025 annual call - where the April-2025 regulatory reset and the deliberate shift to high-quality, lower-priced users were first framed as a multi-quarter strategy, setting up the Q1 2026 numbers. · Open →
Q3 2025 Earnings Call — Q3 2025 · 23 pages · A mid-reset update: read here for the early results of the risk-tightening measures and the first signs of a tightening funding market. · Open →
Q2 2025 Earnings Call — Q2 2025 · 22 pages · The clearest read on the October-2025 ICE rule change: management's multi-scenario contingency plan, plus take-rate math at a 5.4% peak and record ABS issuance. · Open →
Q1 2025 Earnings Call — Q1 2025 · 22 pages · The last quarter before the April-2025 rules bit - peak profitability and buyback cadence, a useful 'before' baseline for the reset. · Open →
Q3 2024 Earnings Call — Q3 2024 · 22 pages · The recovery quarter: loan volume returned to sequential growth and the take rate resumed its climb, ahead of the record Q4. · Open →
Q2 2024 Earnings Call — Q2 2024 · 22 pages · Mid-2024 execution of the efficiency-over-scale strategy, with the embedded-finance channel and shareholder-return cadence reiterated. · Open →
Q1 2024 Earnings Call — Q1 2024 · 22 pages · The first quarter delivering on the FY2023 pivot - the seasonal trough management flagged, with risk metrics starting to mend. · Open →
Q1 2022 Earnings Call — Q1 2022 · 26 pages · The dual-shock call: navigating COVID-lockdown asset-quality stress and the 24% rate-cap transition, with management defending take rate via a lifetime-value argument. · Open →
Qfin Holdings, Inc.'s annual reports contain management's most considered account of the business. These are the sections, passages and visual pages worth opening in the originals preserved in Sources.
Qfin Holdings, Inc. — FY2025 Annual Report (Form 20-F) — FY2025
Management's fullest account of an AI credit platform that bears the loans' credit risk — VIE structure, the risk engine, asset quality, and the guarantee model. · Open the full document →
Item 3. Key Information — Our Holding Company Structure and Contractual Arrangements with the VIEs — p. 9 · Read the full section →
What ADS holders actually own: a Cayman shell that controls its China business only by contract, where the VIEs booked 96% of 2025 revenue.
Item 3.D. Risk Factors — Risks Related to Our Business and Industry — p. 28 · Read the full section →
The two company-specific risks that can actually bite: a consumer-credit book never tested through a full cycle, and regulatory caps on loan pricing.
Fees above the 24% private-lending limit are unenforceable; above 36% they are invalid.
in the event that the sum of the annualized interest that lenders charge and the fees we and our financia institution partners charge exceeds the 24% limit, and borrowers refused to pay the portion that exceeds the 24% limit, PRC courts would not uphold our request to demand the portion of the fees that exceeds the 24% limit from such borrowers. If the sum of the annualized interest that lenders charge and the fees we and our financial institution partners charge exceeds 36%, the portion that exceeds the 36% limit is invalid.
p. 34 · Read in context →
Item 4. B. Business Overview — p. 89 · Read the full section →
How Qifu makes money — credit-driven services (where it bears credit risk) versus capital-light platform services, with three years of volume and balance mix.
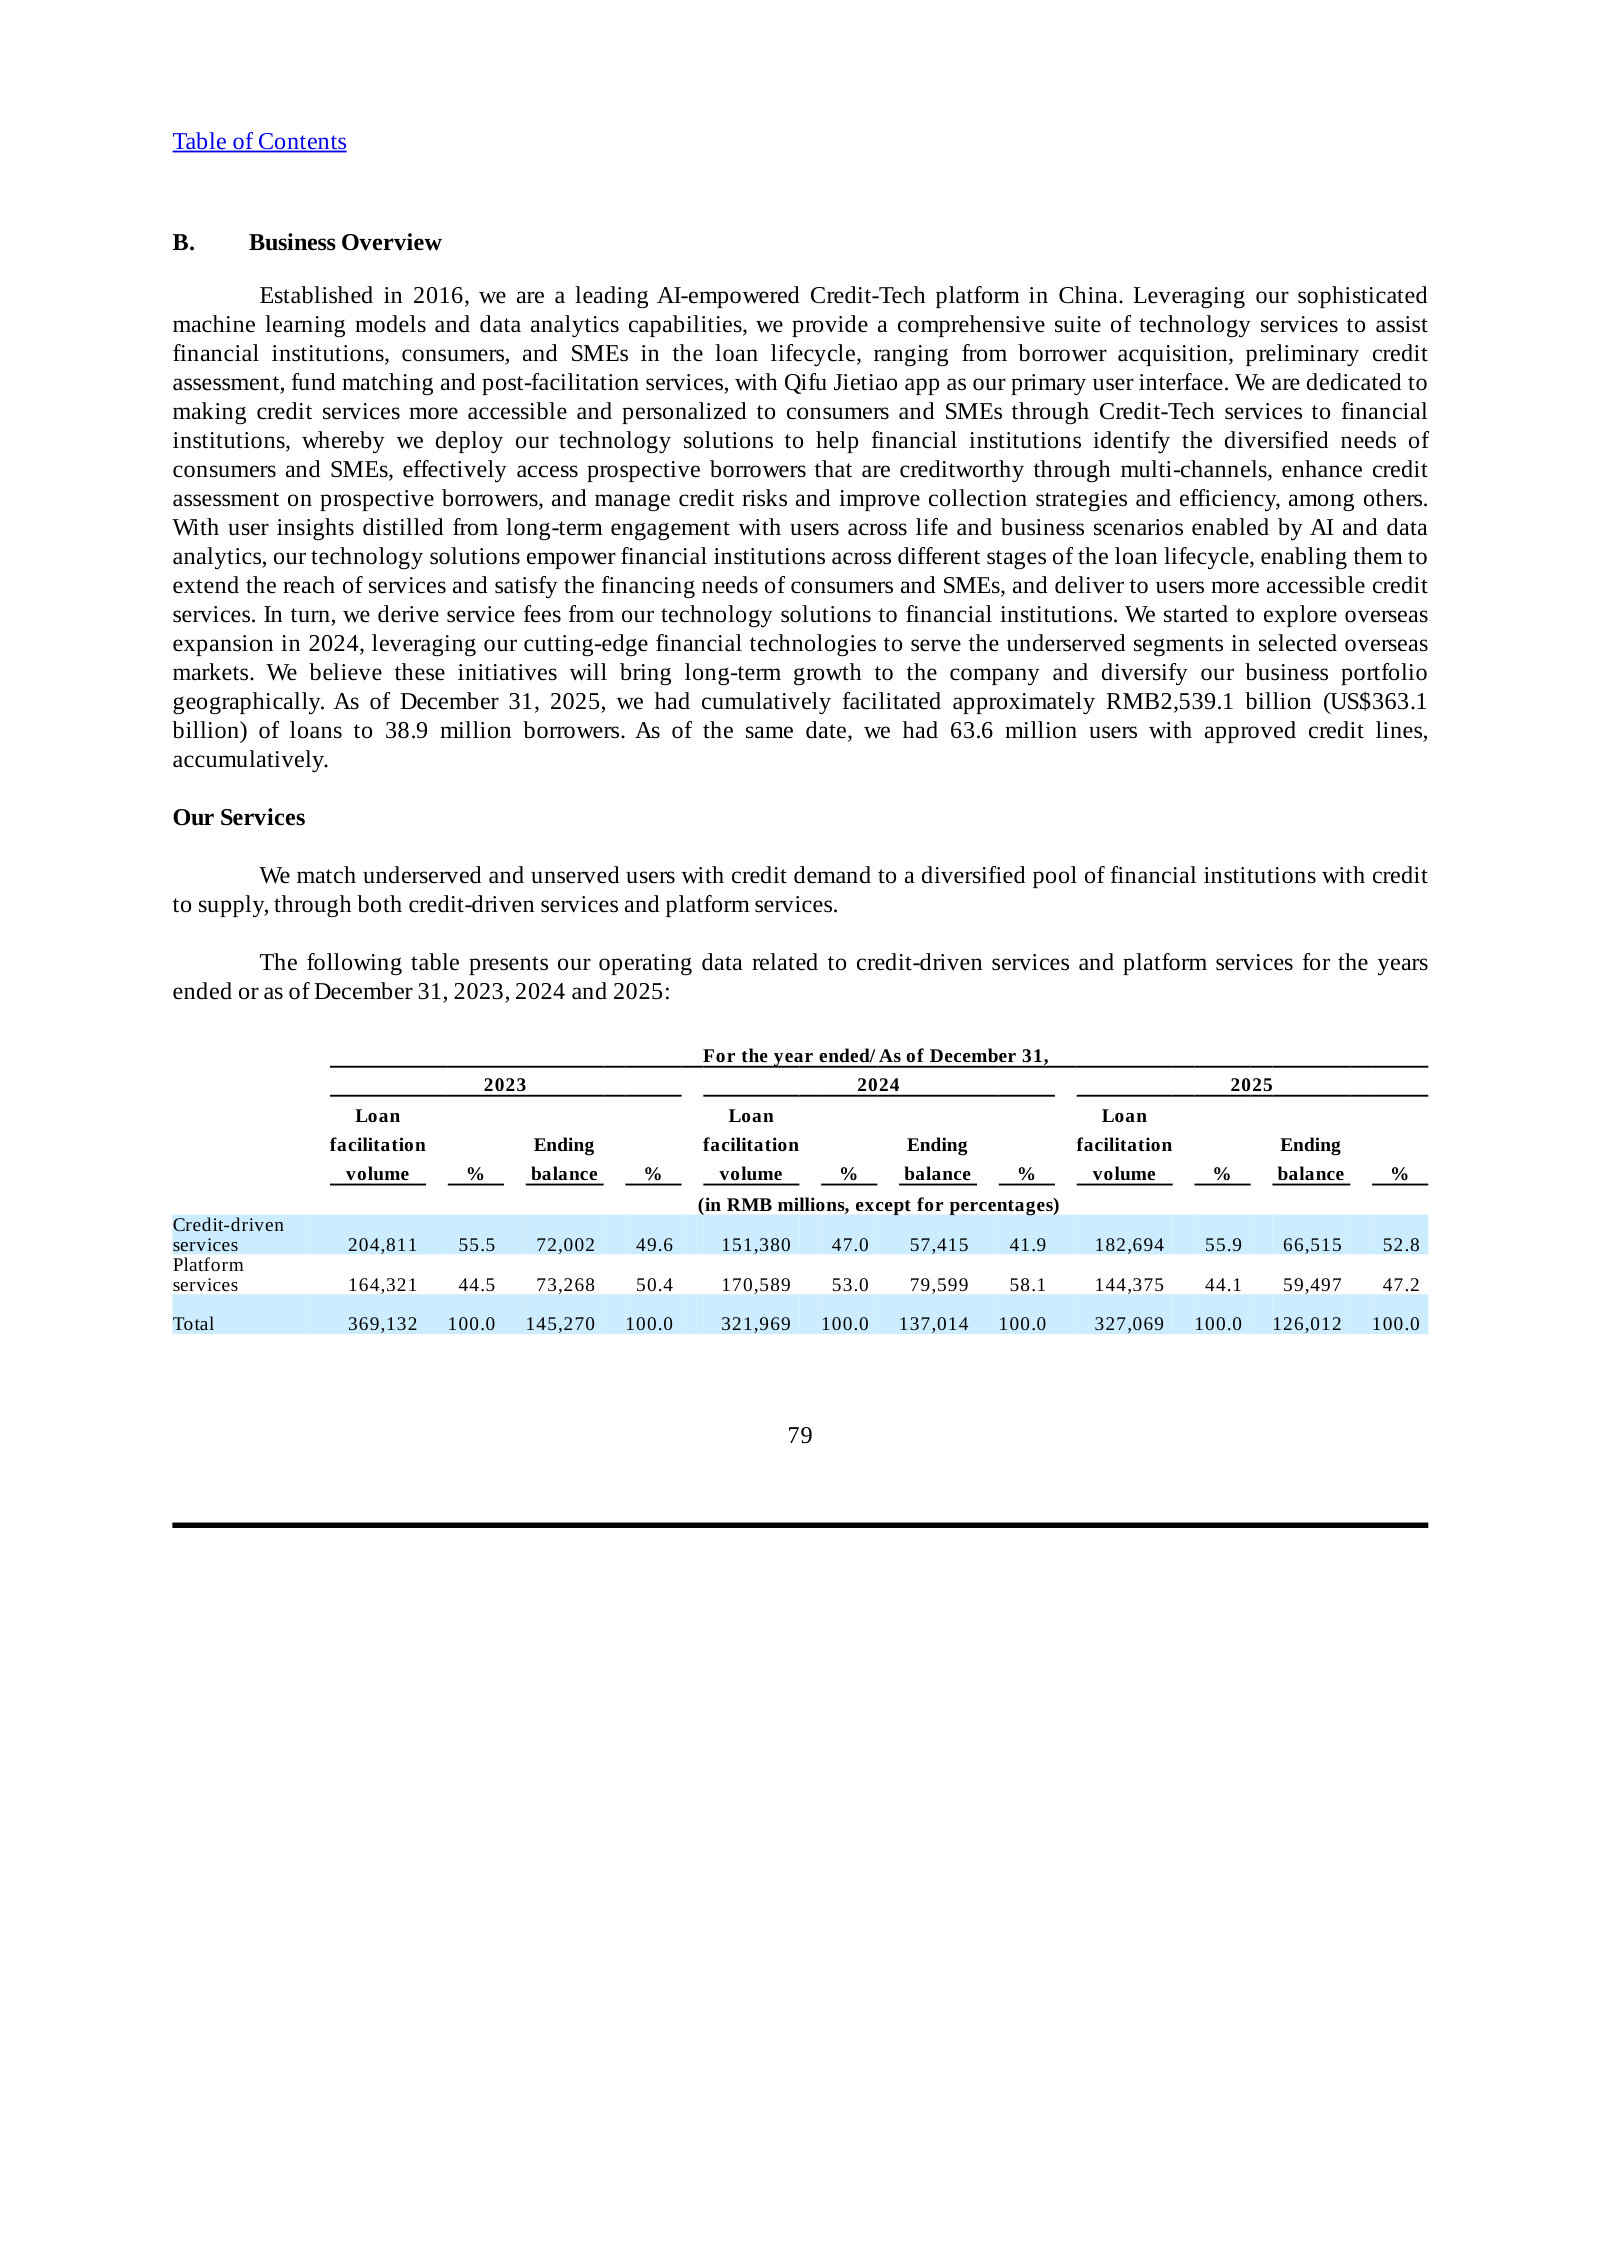
Under credit-driven services the company bears credit risk and guarantees financial-institution loans against default.
Under the credit-driven services category, we match prospective borrowers with financial institutions and empower financial institutions in borrower acquisition, credit assessment, fund matching and post-facilitation services. […] In both cases, we bear credit risks of the loans. For loans extended by our financial institution partners, we provide guarantees against potential defaults.
p. 90 · Read in context →
Item 4. B. Business Overview — Credit Assessment — p. 97 · Read the full section →
The Argus Engine — the machine-learning risk and anti-fraud engine that is the platform's core competitive claim.
Item 5. Operating and Financial Review — Loan Performance and On/Off-Balance Sheet Treatment of Loans — p. 137 · Read the full section →
Where management explains asset quality — the 90-day+ delinquency uptick under 2025 rate caps — and how loans land on or off the balance sheet.
90-day+ delinquency rose to 2.71% in 2025 amid interest-rate caps and industry-wide liquidity tightening.
The overall 90 day+ delinquency rate increased from 2.09% as of December 31, 2024 to 2.71% as of December 31, 2025, primarily due to macroeconomic uncertainties and recent regulatory changes in China. Since April 2025, regulators have issued a series of measures targeting the consumer finance industry, including interest rate caps, which have contributed to a broader industry-wide liquidity tightening, particularly in the second half of 2025.
p. 137 · Read in context →
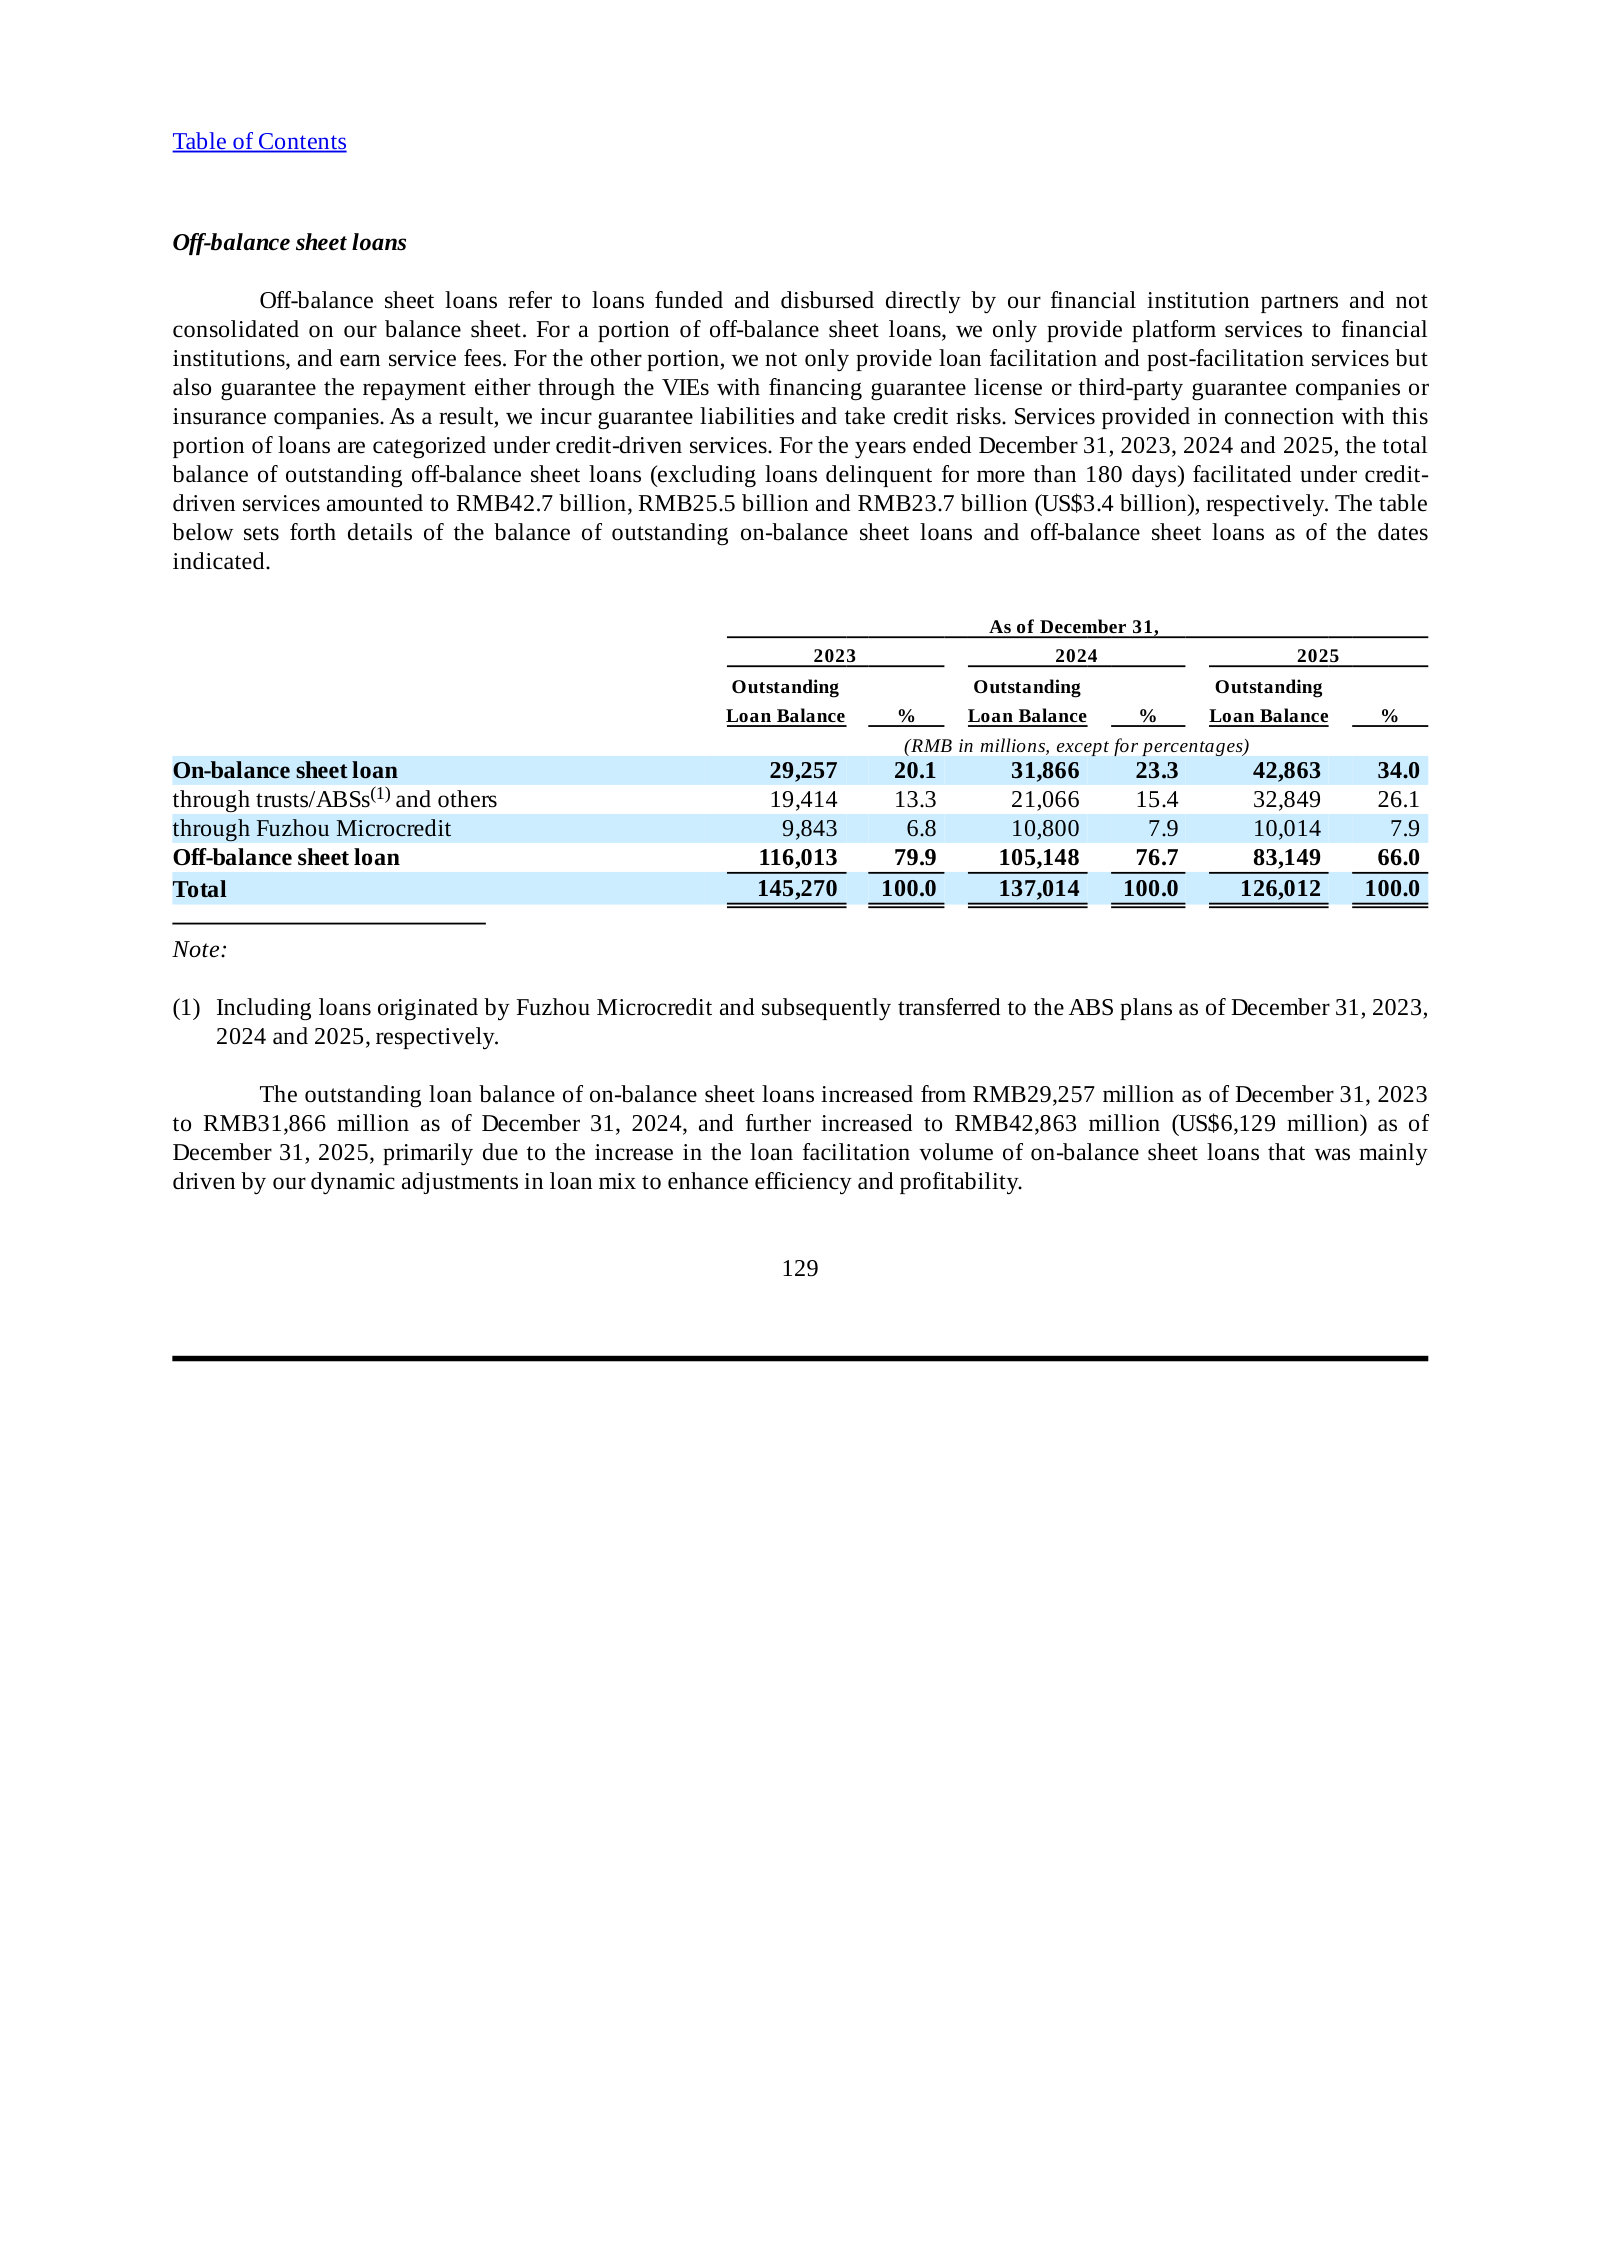
Item 5. Operating and Financial Review — Results of Operations — p. 146 · Read the full section →
The revenue-mix and profitability bridge: credit-driven vs. platform revenue, provisions, and net income across 2023–2025.
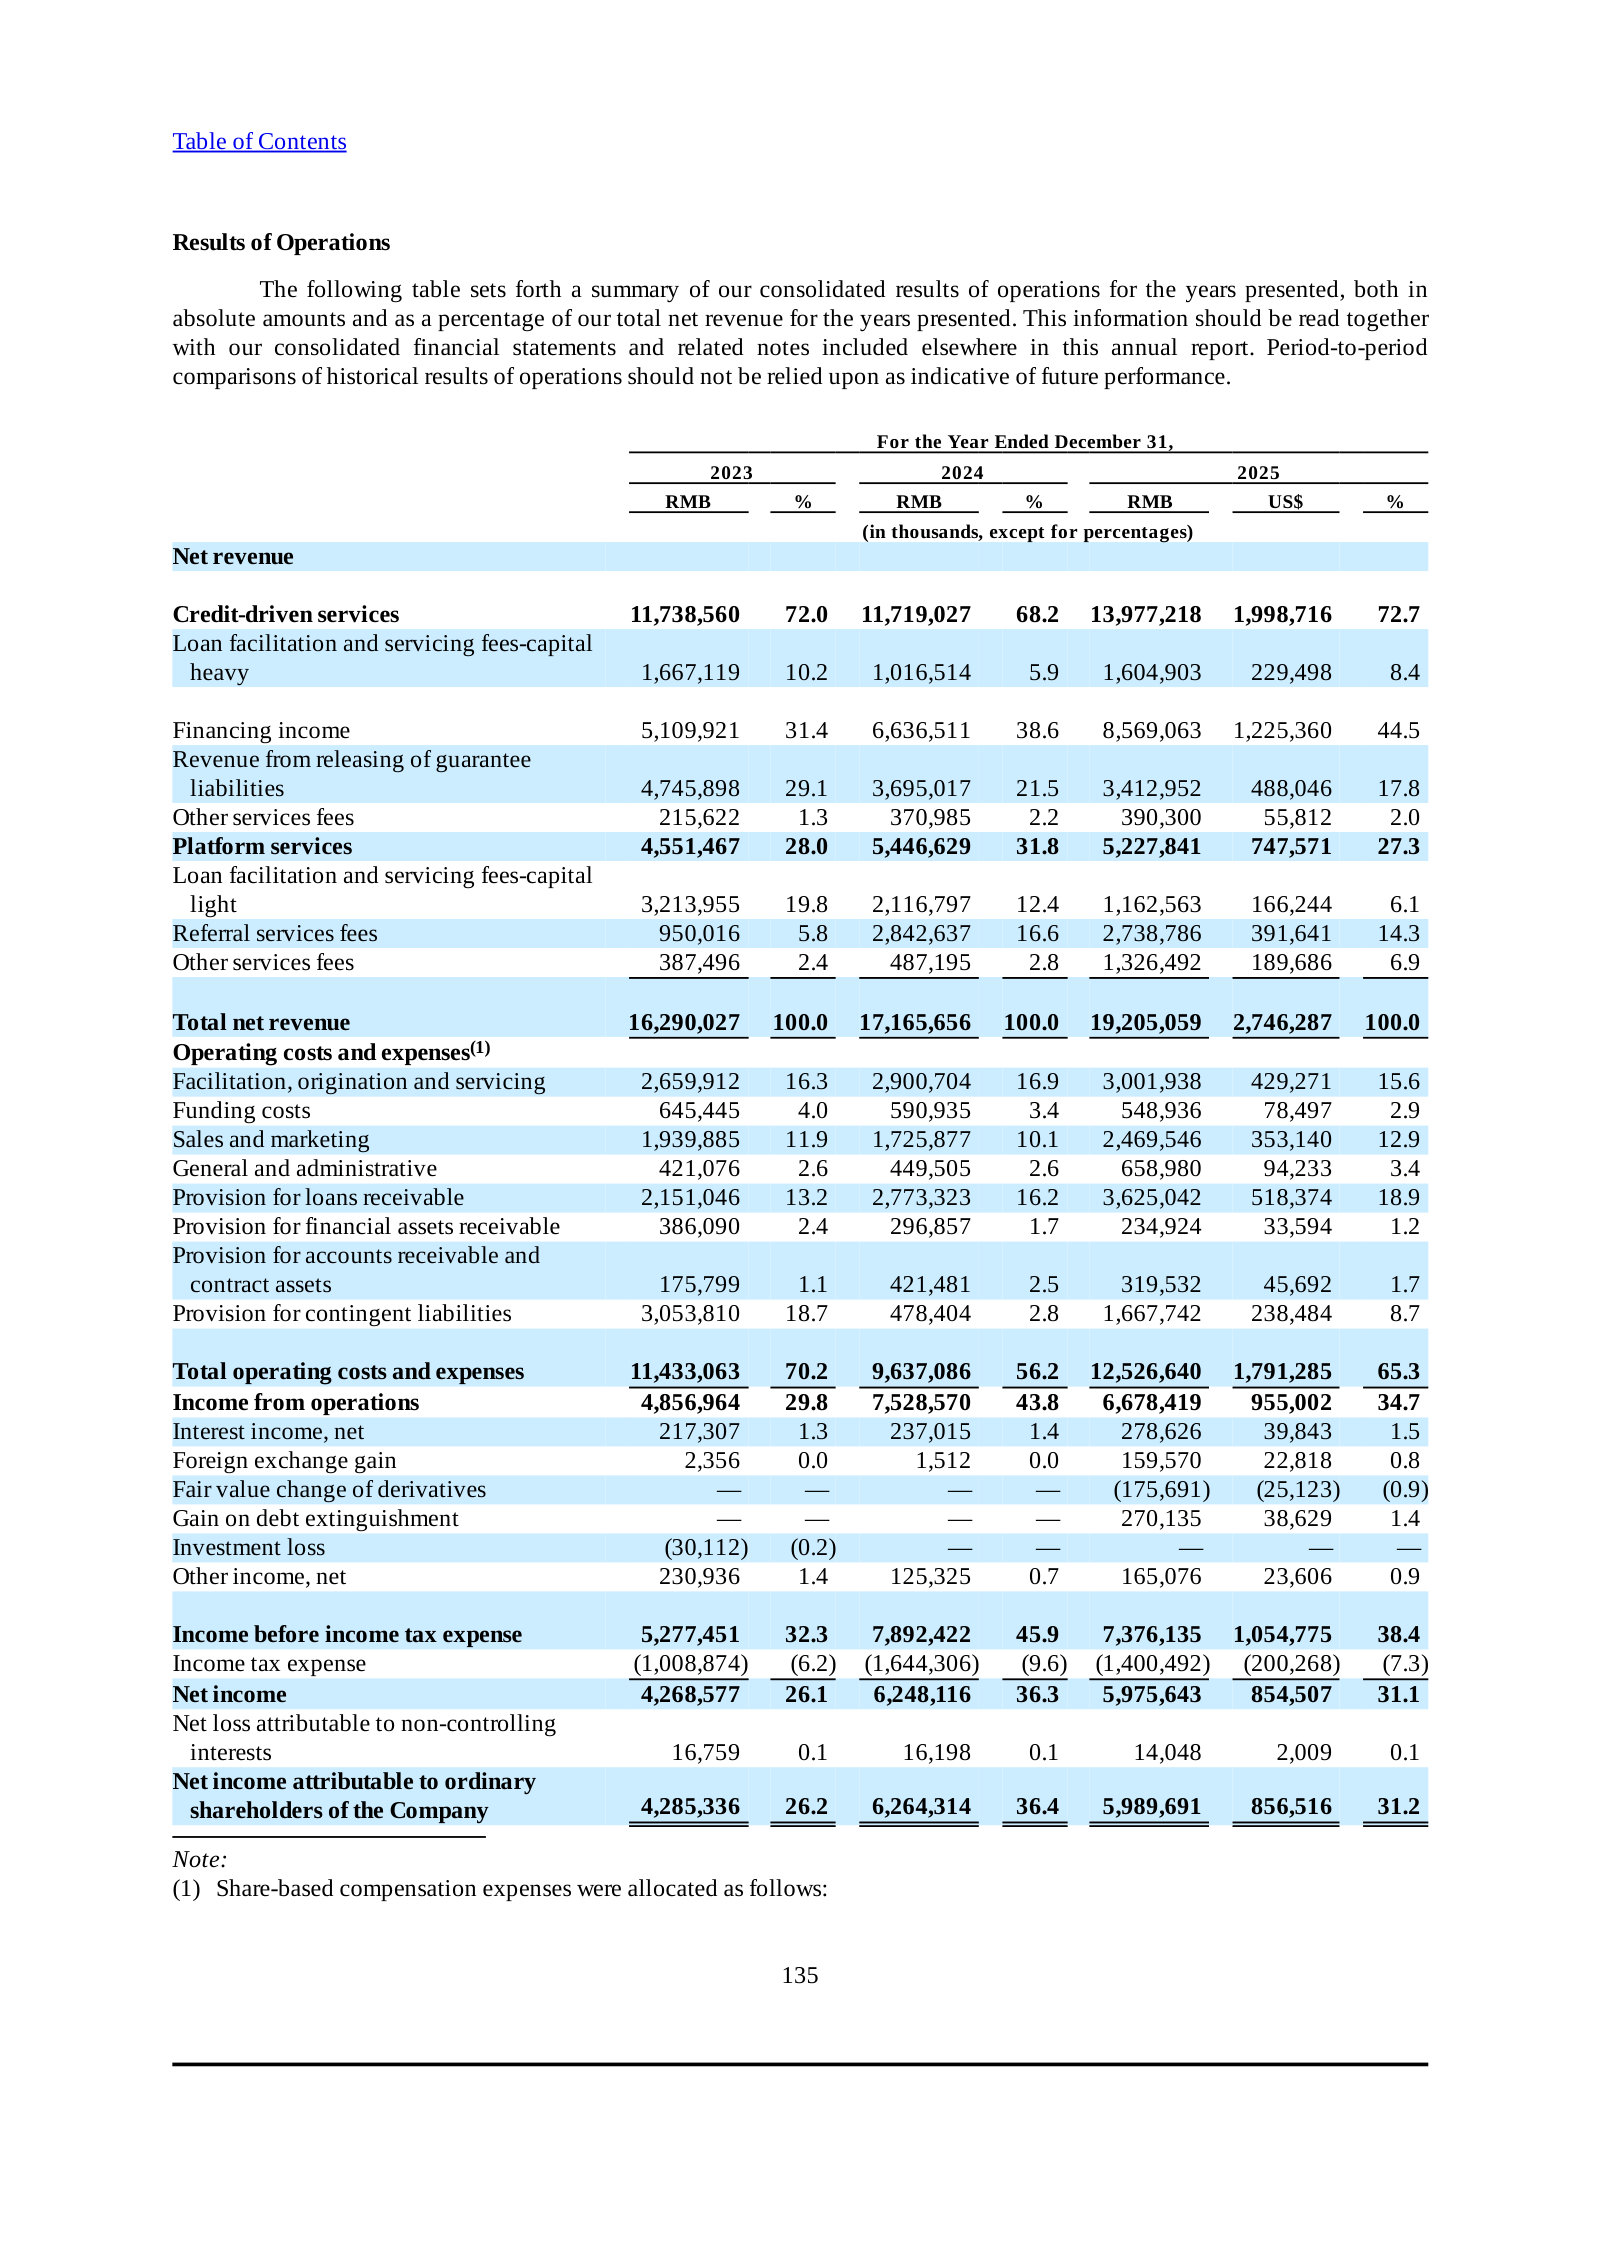
Item 5.E. Critical Accounting Estimates — Guarantee Liabilities — p. 155 · Read the full section →
The accounting that defines the business model: because Qifu guarantees off-balance-sheet loans, a stand-ready guarantee liability sits at the center of its economics.
Guarantees on off-balance-sheet loans are booked as a fair-value stand-ready liability driven by estimated default rates.
For off-balance sheet loans facilitated where we effectively take on the credit risk of the borrowers through providing guarantee directly or cooperating with third-party licensed vendors including financing guarantee companies and insurance companies to provide guarantee, we recognize a stand ready guarantee liability at fair value. The fair value of stand ready guarantee liability is estimated using discounted cash flow model based on expected net payouts by incorporating a markup margin.
p. 157 · Read in context →
More annual reports
Qifu Technology, Inc. — FY2024 Annual Report (Form 20-F) — FY2024 · 331 pages · Filed as Qifu Technology (pre-rename); first edition to disclose the 2024 start of overseas expansion. · Open →
Qifu Technology, Inc. — FY2023 Annual Report (Form 20-F) — FY2023 · 286 pages · Captures the risk-tightening in 2H2023 that drove delinquency down to 2.35%, the low the 2025 report benchmarks against. · Open →
Qifu Technology, Inc. — FY2022 Annual Report (Form 20-F) — FY2022 · 420 pages · First edition under the Qifu Technology name (rebranded from 360 DigiTech), spanning the post-crackdown reset. · Open →
360 DigiTech, Inc. — FY2021 Annual Report (Form 20-F) — FY2021 · 223 pages · Earliest edition on the shelf, filed under the original 360 DigiTech name during China's fintech regulatory overhaul. · Open →
Competitors describe Qifu Technology, Inc.'s market in their own filings and calls. These verified passages and visual pages show where their strategies meet, using source documents preserved in Sources.
FinVolution Group (FINV)
The closest structural analog to Qifu: a large, profitable, capital-light Chinese loan-facilitation platform that connects consumer and SME borrowers with licensed funding partners, competes on take rate and funding cost, and operates under the same October 2025 loan-facilitation rules — while diversifying internationally.
FinVolution reports FY2025 group revenue of RMB13.6 billion and full-year transaction volume of RMB200 billion (down 2.9%), citing China regulatory uncertainty, while international revenue rose to 31% of the quarter's total.
Tiezheng Li, Chief Executive Officer: we delivered full year group revenue of RMB 13.6 billion, up 3.8% year-over-year. Net profit also rose to RMB 2.5 billion, a 6.6% increase from last year. The resilient financial performance was achieved despite the regulatory uncertainty in China in the second half of the year, which tempered the full year transaction volume to RMB 200 billion, down 2.9% year-over-year. Our local excellence global outlook strategy has unlocked diversification value and brought much needed resilience to our platform. In 2025, our international business grew significantly. Our volume increased by 38.6% and revenue rose by 32.0% year-over-year. Most notably, international business contributed 31% of revenue for the quarter, significantly higher than 21% just a year ago.
p. 7 · Read in context →
FinVolution's CFO states it added new funding partners and cut funding cost 20bps to 3.4% in Q4, with take rate holding steady at around 3%.
Jiayuan Xu, Chief Financial Officer: We continue to deepen our engagement with funding partners as the funding supply of dynamics start to normalize. In Q4, we added new funding partners and further reduced funding cost by 20 basis points quarter-on-quarter to 3.4%. Overall, our take rate held steady at around 3%.
p. 11 · Read in context →
FinVolution's CEO frames the October 2025 Internet loan-facilitation rules as reshaping loan mix and asset risk profiles, and reports its China institutional funding partners expanded from 114 to 119 in the quarter.
Tiezheng Li, Chief Executive Officer: we have now delivered 18 consecutive quarters of yearover-year growth in both transaction volume and revenue, a strong testament to our resilient business fundamentals in today’s fast-changing macro landscape. As discussed in last quarter’s earnings call, regulation in China’s consumer finance sector have been evolving. With the implementation of the new regulation of the Internet loan facilitation business in October. We believe it may have implication to the loan mix and the risk profile of the assets in the industry, and we are closely monitoring the latest development and the dynamics of the sector. We maintain active dialogue with our funding partners, which expanded from 114 to 119 in the second quarter to maintain relatively stable funding supply and prepare in advance for the potential impacts on our transaction volumes and risk metrics.
p. 2 · Read in context →
LexinFintech Holdings (LX)
A direct consumer credit-tech competitor (Fenqile) targeting the same young, prime and small-business borrowers with AI risk models, funding-partner networks and the 24% APR ceiling — and one of the few peers that explicitly describes the shared China credit-service market and its rivals in its filings.
LexinFintech's FY2025 annual report characterizes China's credit-service market as well-developed and highly competitive, naming major internet companies, traditional financial institutions and other installment-loan providers as rivals and claiming edges in scenarios, risk efficiency and user experience.
The credit service market in China is well-developed and highly competitive. As a leading credit technology-empowered consumer financial service enabler in China, we compete with major internet companies, traditional financial institutions, and other installment loan service providers with similar business matrix. Some participants in the internet industry have built up large user bases relying on their strengths in e-commerce platform scenarios and financial resources. With the more active implementation of anti-monopoly policies in China, we expect the market landscape to change in favor of smaller players, with more opportunities to develop their strength and gain market share in their specific market segments. We are strategically focused on the young generation consumers that are not fully covered by traditional financial institutions. Our consumption scenarios, risk management efficiency and superior user experience are major and unique competitiveness that we enjoy over banks and other platform operators.
p. 87 · Read in context →
On its Q4 FY2025 call, LexinFintech management describes capping all new loans at or below the 24% comprehensive-rate ceiling and attributes a sharp net-income drop to that pricing cut and to deliberately shrinking loan volume.
Xigui Zheng, Chief Financial Officer: We have strictly followed the regulatory requirements, ensuring that the comprehensive interest rate for all new loans is capped at or below 24%. Following the implementation of these new regulations, we observed elevated volatility in industry-wide credit risk. This complex market environment created challenges for our performance. In the fourth quarter, our net income recorded RMB 214 million. This sequential decrease was primarily driven by the pricing adjustment to strictly complying with the 24% cap, coupled with the contraction in loan volume resulting from our prudent strategy to proactively manage risk exposure.
p. 11 · Read in context →
LexinFintech's FY2025 annual report states its cumulative loan originations since 2013 and annual origination volumes of RMB250bn, RMB212bn and RMB205bn for 2023-2025, served to roughly 8.2 million active users.
From our inception in August 2013 through December 31, 2025, we cumulatively originated RMB1,531 billion (US$219 billion) in loans. In 2023, 2024 and 2025, we originated RMB250 billion, RMB212 billion and RMB205 billion (US$29.4 billion) in loans, respectively, for approximately 8.5 million, 8.2 million and 8.2 million active users.
p. 43 · Read in context →
Lufax Holding (LU)
A large China consumer/SME-credit facilitator whose strategic path diverges sharply from Qifu's capital-light model: Lufax has shifted to a capital-heavy '100% guarantee' model, taking credit risk onto its own book — a live contrast for how facilitation economics can be structured in the same market.
Lufax states the share of outstanding loans on which it bears credit risk rose from 23.5% (2022) to 39.8% (2023) and 74.5% (2024) as it guarantees a larger loan proportion.
We have increased the percentage of outstanding loans with credit risk exposure for our company from 23.5% as of December 31, 2022, to 39.8% as of December 31, 2023, and further to 74.5% as of December 31, 2024.
p. 34 · Read in context →
Lufax discloses a cumulative 25.9 million borrowers as of December 31, 2024, with active borrowers of 4.8m (2022), 3.9m (2023) and 5.0m (2024).
We had a cumulative total of 25.9 million borrowers as of December 31, 2024. The number of active borrowers for whom we enabled loans was 4.8 million in 2022, 3.9 million in 2023 and 5.0 million in 2024.
p. 95 · Read in context →
Lufax's Co-CEO states that new business under its 100% guarantee model carries a gross take rate approaching 14 percentage points, roughly double the prior CGI-model level.
Gregory Gibb, Co-CEO and Director: if you look at new business that's now being done under the 100% guarantee model, the gross take rate is approaching 14 percentage points, right? So basically, it's effectively a doubling from where we were a couple of quarters ago, as we shift from the CGI model now to more and more under the guarantee model. So this is a trend that we will expect to continue. So as we move throughout the course of this year, such that more and more of the book is 100% guarantee model, you should see the overall take rate converge up to about 14%.
p. 8 · Read in context →
X Financial (XYF)
A direct loan-facilitation competitor connecting prime borrowers with institutional funding partners via proprietary big-data risk models, navigating the same Notice 9 / 24% pricing-cap regime and competing on funding cost and asset quality.
X Financial's CFSO tells investors that Notice 9 (issued by the NFRA on April 1, 2025) is driving a de facto 24% total-borrowing-cost ceiling across the industry, with microcredit and consumer-finance lenders potentially facing even lower caps.
Noah Kauffman, Chief Financial Strategy Officer: The most significant development was Notice 9 issued by the National Financial Regulatory Administration on April 1, 2025, which requires commercial banks to strictly control total borrowing costs. While Notice 9 does not explicitly stipulate a hard cap, in practice, a 24% annum ceiling on total borrowing costs for a single loan is generally being implemented and enforced across the industry. Importantly, 24% may not represent the outer boundary of that pricing pressure. Regulatory authorities have continued to tighten borrowing cost caps applicable to microcredit and consumer finance companies, and those entities may face de facto requirements set below that level. The pace and manner of implementation across different institution types and jurisdictions remain highly uncertain, and we currently have no reliable basis on which to predict the ultimate scope or trajectory of these limitations.
p. 7 · Read in context →
X Financial's FY2025 20-F describes its business as a technology-driven loan-facilitation platform connecting borrowers to institutional funding partners, with its primary Xiaoying Credit Loan product, total loans facilitated of RMB 130,552 million in 2025 and a 31–60 day delinquency rate rising to 2.90%.
X Financial is a leading Chinese fintech platform focused on technology-driven personal finance and loan facilitation, committed to connecting borrowers with institutional funding partners through proprietary big data-driven technology. We have established strategic partnerships with financial institutions across multiple areas of our operations, enabling us to facilitate loans to prime borrowers under a robust risk assessment and control system. We offer differentiated products specifically catered to the financing needs of individuals in Chinese Mainland. Our primary loan product is Xiaoying Credit Loan, a category of online personal credit loan products facilitated through our platform, including our flagship product Xiaoying Card Loan — which offers borrowers a combination of small credit lines and attractive interest rates — and other unsecured loan products we introduce from time to time. In 2023, 2024, and 2025, total loans facilitated amounted to RMB 105,557 million, RMB 104,889 million, and RMB 130,552 million, respectively. The delinquency rate for outstanding loans 31-60 days past due increased from 1.17% as of December 31, 2024 to 2.90% as of December 31, 2025. As of December 31, 2023, 2024, and 2025, the IRR of our major loan products did not exceed 36%.
p. 106 · Read in context →
X Financial reports Q3 2025 loan facilitation of RMB 33.64 billion, RMB 62.83 billion outstanding balance, roughly 2.44 million active borrowers, and says it strengthened AI-driven analytics for borrower identification and early delinquency detection.
Noah Kauffman, Chief Financial Strategy Officer: On the operational overview, during the quarter, we facilitated RMB 33.64 billion in loans, up 18.7% year-over-year and ended the period with RMB 62.83 billion in outstanding loan balance, up 37.3% from last year. We facilitated approximately 3.48 million loans, representing a 32% increase year-over-year with an average loan size of RMB 9,654. Our active borrower base was approximately 2.44 million, 14.4% lower sequentially, but 24.2% higher year-over-year. These figures demonstrate the resilience of our franchise even as we moderated new origination activity to preserve credit quality. We refined our risk models, reduced exposure to lower tier channels and focused more heavily on established higherquality borrower sources. We also continued to strengthen our AI-driven analytics to improve borrower identification and early delinquency detection.
p. 3 · Read in context →
Jiayin Group (JFIN)
A direct Chinese loan-facilitation competitor connecting underserved borrowers with financial institutions through a proprietary big-data risk model, competing on the same funding-partner relationships, take-rate mix and post-regulation pricing.
In its Q3 2025 earnings call, Jiayin Group's CEO reported RMB 32.2 billion in quarterly loan-facilitation volume (up ~20.6% YoY) and cooperation with 75 financial institutions plus 64 more under negotiation.
Yan Dinggui, Chief Executive Officer: In this quarter, the company facilitated RMB 32.2 billion in loan volume, a year-on-year increase of approximately 20.6%, and reported non-GAAP income from operation of RMB 190 million, up around 50.3% year-on-year, achieving our previously issued guidance. During the reporting period, the company maintained cooperation with 75 financial institutions, with another 64 under negotiation. We have been included in the white list by most of our partner financial institutions, providing a solid foundation for stable funding supply.
p. 6 · Read in context →
On its Q2 2025 call, Jiayin Group's CFO said facilitation-service revenue rose ~70% YoY to RMB 1.609 billion and grew to 85% of total revenue (from 64%), while lower-margin guarantee revenue fell from ~29% to under 7%.
Chunlin Fan, Chief Financial Officer: the company’s facilitation service revenue reached RMB 1.609 billion, about a 70% increase compared to the previous year. In terms of revenue contribution, facilitation service revenue share of the total revenue increased from 64% in Q2 last year to 85% in Q2 this year. Correspondingly, the proportion of lower margin guarantee-related service revenue decreased from about 29% in Q2 2024 to less than 7% in Q2 2025
p. 11 · Read in context →
Yiren Digital (YRD)
A direct — if more diversified — Chinese loan-facilitation competitor whose credit business relies on the same institutional-funding-partner model and repeat-borrower economics, and which frames the tightening-regulation landscape as thinning the field of national-level players.
Yiren Digital's FY2025 annual report characterizes its competitive landscape, stating that as domestic regulation tightens and entry barriers rise, fewer national-level loan-facilitation players remain while smaller platforms cease operations, leaving more market-share opportunity for firms like itself.
The industries our company and the VIEs are operating in are competitive and evolving. We compete with financial products and companies that attract borrowers and clients, partners, or all of these. For our credit solution business, our company and the VIEs compete with other consumer finance marketplaces and loan facilitation platforms that were intensely competitive before the year 2018. However, as the domestic regulations on the industry evolve and entry barriers continue to increase in recent years, fewer national-level players like us remain in the market while smaller platforms cease their operations, leaving more market share opportunities for us.
p. 27 · Read in context →
On its Q2 2025 call, Yiren Digital's CFO reported financial-services loan-facilitation volume up 57% YoY to RMB20.3 billion, repeat borrowers at 77% of volume (up from 56% a year earlier), and segment revenue up 75% YoY to RMB1.5 billion, contributing about 90% of total net revenue.
Ka Chun Hui, CFO: In the financial services segment, total loan facilitation volume increased by 57% year-overyear to RMB 20.3 billion in the second quarter. The increase was driven by the strong demand for our small revolving loan products and the growth of repeat borrowers, which accounts for 77% by loan volume in the second quarter this year, up from 56% a year ago. The revenue from this segment increased by 75% year-on-year to RMB 1.5 billion in the second quarter. This segment contributes about 90% of the total net revenue of the company.
p. 6 · Read in context →
More peer documents
FINV_annual_report_FY2025 — 223 pages · FinVolution's FY2025 20-F sizes its China platform (cumulative 187.4 million registered users, RMB186.3 billion of 2025 loan origination, RMB68.3 billion outstanding balance) — the structural scale benchmark behind the transcript exhibits. · Open →
Q1_FY2026 — 21 pages · FinVolution's CEO frames the new China rules as requiring core credit and risk decisions to rest with licensed financial institutions, casting FINV — like Qifu — as a technology-and-data provider whose partners make the final lending calls. · Open →
Q1_FY2026 — 21 pages · LexinFintech management describes its non-core 'ecosystem' businesses reaching ~50% of loan volume and 56%/30% sequential growth in prime white-collar and small-business borrowers — the prime-segment competition most directly overlapping Qifu's book. · Open →
Q4_FY2023 — 11 pages · Lufax's Chairman explains completing the migration to the 100% guarantee model after partner credit-guarantee-insurance premiums hurt revenue — the rationale behind the capital-heavy risk-taking shown in the featured exhibits. · Open →
Q2_FY2024 — 7 pages · Lufax's Chairman cites Ping An lifting its stake to 56.8%, using the parent's Fortune 500 brand as a trust and potential funding-cost advantage — a structural backstop Qifu does not have. · Open →
Q2_FY2025 — 14 pages · X Financial's record Q2 2025 (RMB38.99 billion originations, up 71.4% YoY) marks the pre-tightening peak scale against which its later moderation of volume can be read. · Open →
JFIN_annual_report_FY2025 — 346 pages · Jiayin's FY2025 annual report positions it as 'one of the leading fintech platforms in China' with a proprietary big-data risk model and details its Indonesia-led overseas expansion — the strategic framing behind its transcript volume and mix exhibits. · Open →
Q4_FY2025 — 23 pages · Yiren Digital's Q4 2025 call details its quality-over-growth shift — repeat-borrowing at 77% of volume and a larger average ticket — the same defensive posture Qifu adopted through the downturn. · Open →
Source: S&P Capital IQ consensus via Xpressfeed · Generated 2026-07-27.
Qfin's consensus has been cut hard — FY27–28 revenue and normalized EPS down 20–30% over six months — though the pace has flattened to roughly unchanged in the last month. The model shows a sharp 2026 reset, with revenue off about a quarter year-on-year, then a gradual climb back through 2028. Two straight revenue misses, including −13% in Q4 2025, broke an earlier run of beats, yet 11 of 13 analysts stay positive. Figures are in Chinese renminbi; outer-year and EBITDA coverage is thin.
Estimate momentum
The heavy revisions landed months ago; over the last 30 days both lines are essentially unchanged, and FY28 EPS has even ticked up versus 90 days ago.
Currency: CNY · Scale: money in millions, absolute · Point-in-time consensus; Δ90d is Now versus 90d.
| Metric | FY | 180d | 90d | 30d | Now | Δ90d |
|---|---|---|---|---|---|---|
| EPS (normalized) | FY2027 | CNY 43.31 | CNY 34.67 | CNY 32.94 | CNY 31.89 | -8.0% |
| EPS (normalized) | FY2028 | — | CNY 36.00 | CNY 37.04 | CNY 37.04 | +2.9% |
| Revenue | FY2027 | CNY 18.45bn | CNY 15.28bn | CNY 14.75bn | CNY 14.41bn | -5.7% |
| Revenue | FY2028 | CNY 21.71bn | CNY 14.80bn | CNY 14.98bn | CNY 14.95bn | +1.0% |
Beat / miss record
Current sequences by metric: Revenue: 2 consecutive misses.
Currency: CNY · Scale: money in millions, absolute · Consensus is captured before each actual first became effective.
| Quarter | Metric | Consensus | Actual | Surprise | Outcome |
|---|---|---|---|---|---|
| Q1 FY2026 | Revenue | CNY 4.01bn | CNY 3.91bn | -2.6% | Miss |
| Q4 FY2025 | Revenue | CNY 4.73bn | CNY 4.09bn | -13.4% | Miss |
| Q3 FY2025 | Revenue | CNY 4.98bn | CNY 5.21bn | +4.6% | Beat |
| Q2 FY2025 | Revenue | CNY 4.68bn | CNY 5.22bn | +11.5% | Beat |
| Q1 FY2025 | Revenue | CNY 4.61bn | CNY 4.69bn | +1.8% | Beat |
| Q2 FY2024 | Revenue | CNY 4.14bn | CNY 4.16bn | +0.5% | Beat |
| Q4 FY2023 | Revenue | CNY 4.26bn | CNY 4.50bn | +5.6% | Beat |
| Q3 FY2023 | Revenue | CNY 4.17bn | CNY 4.28bn | +2.8% | Beat |
Forward estimates
Currency: CNY · Scale: money in millions, absolute · YoY uses the prior fiscal year from the feed; analyst count and range use the first displayed period.
| Metric | FY2025A | FY2026E | FY2027E | FY2028E | YoY | Analysts | Low / high |
|---|---|---|---|---|---|---|---|
| Revenue | CNY 19.31bn | CNY 14.49bn | CNY 14.41bn | CNY 14.95bn | — | 11 | CNY 17.14bn / CNY 19.84bn |
| EPS (normalized) | CNY 46.31 | CNY 29.38 | CNY 31.89 | CNY 37.04 | — | 6 | CNY 44.26 / CNY 48.54 |
| Net income (normalized) | CNY 6.29bn | CNY 3.63bn | CNY 4.03bn | CNY 4.50bn | — | — | — |
Street snapshot
No sell or underperform ratings, and a mean target of ¥148 against a ¥98–204 range — roughly a 2x spread that signals unresolved debate on the recovery.
Currency: CNY · Scale: money in millions, absolute · Analyst counts shown explicitly.
| Street view | Reading | Analysts |
|---|---|---|
| Recommendation mix | Buy 7, Outperform 4, Hold 2, Underperform 0, Sell 0 | 13 |
| Consensus score | 1.62 | 13 |
| Target price | mean CNY 148.1; median CNY 152.5; high CNY 204.1; low CNY 98.30 | 13 |
Analysts split widely on the recovery — FY27 revenue spans ¥11.7bn to ¥16.7bn
The spread widens further into FY28, where both normalized EPS and GAAP net income carry large ranges on single-digit analyst counts.
Currency: CNY · Scale: money in millions, absolute · Spread/mean is absolute high-low divided by absolute mean.
| Metric | Period | Mean | Low–high | Spread/mean | Analysts |
|---|---|---|---|---|---|
| Revenue | FY2027E | CNY 14.41bn | CNY 11.75bn–CNY 16.68bn | 34.3% | 10 |
| Net income (GAAP) | FY2028E | CNY 4.15bn | CNY 3.55bn–CNY 4.99bn | 34.9% | 8 |
| EPS (normalized) | FY2028E | CNY 37.04 | CNY 29.22–CNY 40.65 | 30.9% | 5 |
Coverage thins in the outer years and on EBITDA
EBITDA is estimated by as few as two to four analysts across 2026–2028, and normalized EPS by only five to six; treat outer-year points and any EBITDA read as low-consensus.
Visible Alpha broker models via S&P Xpressfeed · 10 brokers · 370 line items · freshest revision 2026-07-09.
Broker models frame Qifu around a sharp FY2026 reset: loan volume, on-book pricing and earnings all step down from a strong FY2025 as APR compression bites, before a gradual re-acceleration through FY2028. All figures are in the company's reporting currency (CNY); the differentiated lines here are the origination and loan-balance splits, take-rates and funding cost that the headline CapIQ consensus does not break out. Net income is modeled down roughly 40% in FY2026 and only clawing part of it back by FY2028.
Origination engine troughs in FY2026, then re-accelerates through FY2028
Total originations fall about a fifth in FY2026 before returning to mid-single-digit growth; the capital-light off-balance-sheet book leads the recovery while the credit-driven book stays roughly flat. Outstanding loan balance tracks the same trough-and-recover shape.
| Line | FY-2025A | FY-2026E | FY-2027E | FY-2028E | YoY | Brokers |
|---|---|---|---|---|---|---|
| Originations | — | — | — | — | — | — |
| Loan originations | CN¥320.55bn | CN¥256.95bn | CN¥267.48bn | CN¥286.66bn | -19.8% | 7 |
| Loan originations - Credit driven | CN¥168.91bn | CN¥131.23bn | CN¥133.51bn | CN¥134.97bn | -22.3% | 8 |
| Loan originations - Capital light (off-B/S) | CN¥151.64bn | CN¥125.08bn | CN¥131.33bn | CN¥148.40bn | -17.5% | 7 |
| Loan balance | — | — | — | — | — | — |
| Outstanding loan balance | CN¥126.93bn | CN¥105.97bn | CN¥111.34bn | CN¥120.98bn | -16.5% | 8 |
| Loan balance - Credit driven | CN¥61.50bn | CN¥51.46bn | CN¥54.10bn | CN¥57.08bn | -16.3% | 8 |
| Loan balance - Capital light (off-B/S) | CN¥63.15bn | CN¥54.65bn | CN¥56.79bn | CN¥62.10bn | -13.5% | 7 |
Pricing compresses faster than funding cost, halving returns
The on-book APR the street models compresses across the whole forecast while funding cost eases far less, squeezing net spread. Return on average equity roughly halves off FY2025 and the efficiency ratio drifts higher.
| Line | FY-2025A | FY-2026E | FY-2027E | FY-2028E | YoY | Brokers |
|---|---|---|---|---|---|---|
| APR - on B/S(%) | 24.9% | 19.3% | 18.4% | 16.7% | -5.7pt | 7 |
| Cost of funding(%) | 3.2% | 2.4% | 2.3% | 2.3% | -0.8pt | 8 |
| Return on average equity(%) | 24.0% | 13.5% | 13.1% | 13.0% | -10.5pt | 7 |
| Efficiency ratio(%) | 32.3% | 37.3% | 38.5% | 39.3% | +4.9pt | 9 |
Platform (capital-light) revenue takes the deeper cut
In FY2026 platform-services revenue is modeled down far more than the credit-driven book, and referral fees roughly halve. Both stabilize thereafter, so the recovery is led by the heavier credit-driven line rather than the capital-light fees.
| Line | FY-2025A | FY-2026E | FY-2027E | FY-2028E | YoY | Brokers |
|---|---|---|---|---|---|---|
| Credit driven services | CN¥13.49bn | CN¥10.96bn | CN¥10.14bn | CN¥10.48bn | -18.8% | 7 |
| Platform services | CN¥5.92bn | CN¥3.76bn | CN¥3.94bn | CN¥4.12bn | -36.5% | 7 |
| Referral services fees - Platform services | CN¥3.22bn | CN¥1.67bn | CN¥1.67bn | CN¥1.71bn | -48.2% | 8 |
| Total loan facilitation and servicing fees | CN¥3.08bn | CN¥1.79bn | CN¥2.20bn | CN¥2.53bn | -41.8% | 8 |
| Total revenue | CN¥19.46bn | CN¥14.91bn | CN¥14.20bn | CN¥14.40bn | -23.4% | 9 |
Brokers split most on take-rate fees, funding cost and terminal APR
The widest FY2027 dispersion sits on the economically decisive lines — total facilitation fees, cost of funding, credit provisions and on-book APR — not on the headline revenue everyone models tightly.
| Line | Period | Median | Q1–Q3 | Min–max | Brokers |
|---|---|---|---|---|---|
| Total loan facilitation and servicing fees | FY-2027E | CN¥2.10bn | CN¥1.62bn–CN¥2.63bn | CN¥1.42bn–CN¥3.48bn | 8 |
| Cost of funding(%) | FY-2027E | 2.3% | 1.9%–2.6% | 1.5%–3.3% | 8 |
| Provision for loan losses | FY-2027E | CN¥4.46bn | CN¥3.45bn–CN¥4.79bn | CN¥3.02bn–CN¥5.62bn | 10 |
| APR - on B/S(%) | FY-2027E | 18.3% | 17.9%–19.6% | 13.5%–22.4% | 7 |
Dividend per ADS held near CNY 11 through the earnings trough
Models keep the dividend per ADS around CNY 11 (CNY 10.91 in FY2025, CNY 11.05 in FY2026, rising toward CNY 12.14 by FY2028) even as diluted EPADS drops from CNY 44.02 to CNY 27.70 — a payout defended straight through the reset, resting on only five to six brokers.
Differentiated KPI lines rest on a handful of brokers
Consensus is fresh (most lines revised into July 2026), but the differentiated APR, take-rate and dividend lines rest on only four to seven brokers versus nine to ten on headline earnings. A few KPIs (risk-bearing-balance rate, average tenor) sit on two to three models and are excluded — read the KPI detail as indicative, not firm consensus.
Headline P&L consensus, momentum and beat/miss live in the CapIQ tab.
Source: S&P Capital IQ transcripts via Xpressfeed · latest indexed call 2026-05-27 · generated 2026-07-27.
Latest call digest
Qfin Holdings, Inc., Q1 2026 Earnings Call, May 26, 2026 · 2026-05-27T00:30:00
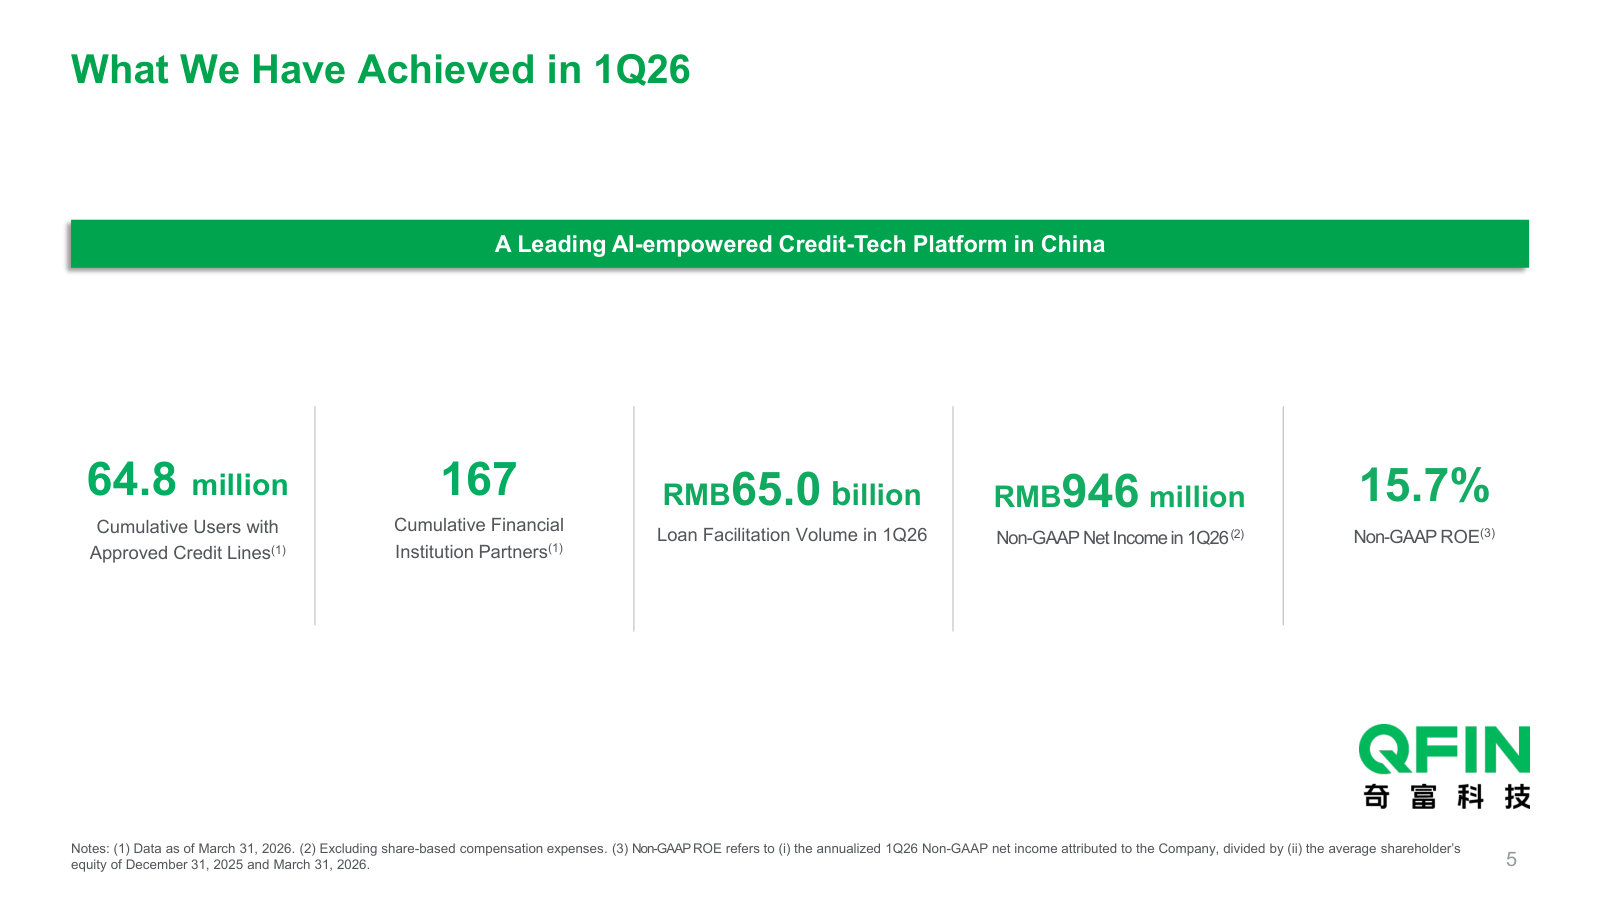
Q1 2026 call (held May 26, 2026). Prepared remarks were built around a single message: after a regulator-driven downturn that ran through the second half of 2025, the risk cycle has turned. Management said FPD 7 for new loans fell roughly 20% versus Q4, and the C2M2 delinquency ratio dropped about 17% sequentially to 0.8%, back to July-August 2025 levels, while the 30-day collection rate rose 1.8 points to 85.8%. The trade-off was scale: total loan facilitation and origination volume fell about 7.5% sequentially to RMB 65 billion, non-GAAP net income fell 11.6% to roughly RMB 950 million, and average IRR slipped to 18.7% from 19.5% as the mix shifted toward high-quality, lower-priced users (marketing spend on that segment up about 40% sequentially). Alongside the core, management leaned hard into two secondary stories: an "AI-native organization" push (98.4% of technical staff using AI tokens by May) with tech-solutions loan volume up sevenfold year-over-year to RMB 9.96 billion, and overseas expansion, now live in the U.K. and a newly launched Latin American market.
The Q&A reality was more skeptical. Morgan Stanley pressed on why Qfin's loan pricing keeps falling while peers hold steady, and where it settles; management defended the decline as a deliberate high-quality-user pivot (pricing down about 80 basis points sequentially, 2.2 points over two quarters) but did not name a floor. UBS asked when risk appetite loosens and volume returns to sequential growth; management declined to commit, repeating that it "won't chase volume growth blindly." On capital return, the notable shift was the CFO calling share buyback "once again" a viable option after pausing it through the downturn, having repurchased roughly USD 577 million of the convertible bond. Guidance actually stated: Q2 2026 non-GAAP net income of RMB 900 million to RMB 980 million, a 47% to 51% year-over-year decline.
Participant coverage from the latest call.
| Group | Participants | Count |
|---|---|---|
| Management | Operator; Karen Ji — Senior Director of Capital Markets, Qfin Holdings, Inc.; Haisheng Wu — CEO & Director, Qfin Holdings, Inc.; Zuoli Xu — CFO & Director, Qfin Holdings, Inc.; Yan Zheng — Chief Risk Officer, Qfin Holdings, Inc. | 5 |
| Analysts | Richard Xu — Managing Director & Equity Analyst, Morgan Stanley, Research Division; Xiaoxiong Ye — Analyst, UBS Investment Bank, Research Division; Yun-Yin Wang — Research Analyst, China Renaissance, Research Division; Yujie Jing — Associate, China International Capital Corporation Limited, Research Division | 4 |
Curated latest-call exchanges; one row per analyst topic.
| Analyst | Firm | Topic | What changed in Q&A |
|---|---|---|---|
| Richard Xu | Morgan Stanley | Loan pricing trajectory and shareholder returns | Pressed on why average pricing keeps declining while peers hold steady, and where it eventually settles. Management framed the fall as a deliberate pivot to high-quality users (pricing down about 80bps sequentially) and a near-term-profit-for-LTV trade-off, but gave no settle point. CFO said buyback is again a viable option alongside a progressive dividend. |
| Xiaoxiong Ye (Alex Ye) | UBS | Loan-growth outlook and risk appetite | Asked, given stabilized asset quality, when the company would raise risk appetite and whether volume returns to sequential growth. Management declined to commit to a timeline, stressing continued prudence and that it will not loosen standards just on short-term improvement. |
| Yun-Yin Wang (Cindy Wang) | China Renaissance | April-May risk performance and acquisition channels | Management said C2M2 stayed stable and improved marginally into April and May, with new-loan FPD 7 roughly flat versus March; blended acquisition cost was kept roughly flat while spend on high-quality users rose about 40% sequentially. |
| Yujie Jing | CICC | Cost reduction and overseas update | Management pointed to further funding-cost savings from a higher ABS mix (down about 10bps) and G&A/collection efficiency plus AI as operating-cost levers; overseas is now live in the U.K. and a Latin American market, with early results described as in line with expectations. |
Theme tracker
Themes are curator-classified across supplied calls.
| Theme | Status | Quarters mentioned | Read-through |
|---|---|---|---|
| Regulator-driven industry restructuring and consolidation | persisted | Q1 2025, Q2 2025, Q3 2025, Q4 2025, Q1 2026 | First raised as a positive signal when April 2025 loan-facilitation rules appeared, then reframed through 2025 into a systemic restructuring that suppressed demand, pricing and liquidity. Management consistently argues the shakeout ultimately favors leading platforms. |
| Pivot to high-quality users over scale | persisted | Q2 2025, Q3 2025, Q4 2025, Q1 2026 | Escalated from a mix tweak into the central strategy in the last two quarters, with management explicitly subordinating volume to asset health and accepting lower near-term pricing and profit for better lifetime value. |
| Overseas / international expansion | emerged | Q4 2024, Q2 2025, Q3 2025, Q4 2025, Q1 2026 | Absent through 2023 and most of 2024, formalized as a wing of the One Core, Two Wings strategy in Q4 2024, operationalized with a small U.K. launch in Q2 2025 and a Latin American market in Q1 2026. Still early-stage and investment-only. |
| AI-native organization, AI agents and tech-solutions business | persisted | Q3 2023, Q4 2024, Q1 2025, Q2 2025, Q3 2025, Q4 2025, Q1 2026 | AI/LLM emerged as a theme in late 2023 and steadily intensified into branded AI agents (AI Loan Officer, AI Credit Officer) and a fast-growing FocusPRO tech-solutions line, most recently framed as a full AI-native transformation with cost savings as a byproduct. |
| Shareholder returns (dividend and buyback) | persisted | Q2 2023, Q3 2023, Q4 2023, Q1 2024, Q2 2024, Q3 2024, Q4 2024, Q1 2025, Q2 2025, Q3 2025, Q4 2025, Q1 2026 | Present every call, but the emphasis shifted: aggressive open-market buybacks in 2024 and early 2025 gave way to a paused buyback, a progressive dividend and convertible-bond repurchases in H2 2025, with buyback described again as viable only in Q1 2026. |
| Tariff / U.S.-China trade-war impact | dropped | Q1 2025, Q2 2025 | Dominated the H1 2025 calls as a driver of demand and risk uncertainty, then disappeared from Q3 2025 onward as the domestic regulatory shock became the sole focus. |
Guidance ledger
Quotes, calls, and speakers are source-verified; outcomes are curator-classified.
| Verbatim guidance | Call | Speaker | Curator outcome | Outcome note |
|---|---|---|---|---|
| “For the second quarter of 2026, the company expects to generate non-GAAP net income between RMB 900 million and RMB 980 million, representing a year-on-year decline between 47% and 51%.” | Qfin Holdings, Inc., Q1 2026 Earnings Call, May 26, 2026 · 2026-05-27T00:30:00 | Zuoli Xu | pending | Guidance for Q2 2026; no later call in the supplied history to confirm the result. |
| “For the first quarter of 2026, the company expects to generate non-GAAP net income between RMB 900 million and RMB 950 million, representing a year-on-year decline between 51% and 53%.” | Qfin Holdings, Inc., Q4 2025 Earnings Call, Mar 17, 2026 · 2026-03-18T00:30:00 | Zuoli Xu | kept | Q1 2026 non-GAAP net income came in at roughly RMB 946 million, within the guided range. |
| “For the fourth quarter of 2025, the company expects to generate non-GAAP net income between RMB 1 billion and RMB 1.2 billion.” | Qfin Holdings, Inc., Q3 2025 Earnings Call, Nov 18, 2025 · 2025-11-19T00:30:00 | Zuoli Xu | kept | Q4 2025 non-GAAP net income was RMB 1.07 billion, within the guided range. |
| “For the third quarter of 2025, the company expects to generate non-GAAP net income between RMB 1.6 billion and RMB 1.8 billion.” | Qfin Holdings, Inc., Q2 2025 Earnings Call, Aug 15, 2025 · 2025-08-15T00:30:00 | Zuoli Xu | missed | Q3 2025 non-GAAP net income was RMB 1.51 billion, below the guided range as the regulatory shock hit harder than assumed. |
| “For the second quarter of 2025, the company expects to generate non-GAAP net income between RMB 1.75 billion and RMB 1.85 billion, representing a year-on-year growth between 24% and 31%.” | Qifu Technology, Inc., Q1 2025 Earnings Call, May 19, 2025 · 2025-05-20T00:30:00 | Zuoli Xu | kept | Q2 2025 non-GAAP net income was RMB 1.85 billion, at the top of the guided range. |
Q&A pressure map
Question counts and firms are curator tallies; analyst coverage shown above.
| Topic | Questions | Firms | Pressure / response |
|---|---|---|---|
| Loan pricing and take rate | 6 | Morgan Stanley, BofA Securities, CICC, China Renaissance | The most persistent pressure point across the window. In Q1 2026 Morgan Stanley pushed on where pricing settles; management gave strategy and direction but no floor, a mild non-answer. |
| Asset quality and risk trajectory | 6 | UBS, BofA Securities, China Renaissance, Morgan Stanley | Analysts repeatedly probed the month-by-month delinquency and collection trend and when risk would stabilize; management answered with specific FPD and C2M2 figures each quarter. |
| Shareholder returns (buyback versus dividend) | 4 | Morgan Stanley, JPMorgan, BofA Securities | Pressed on the pause and resumption of buybacks relative to the progressive dividend, especially after the share-price decline. |
| Loan-volume growth and risk appetite | 4 | UBS, Morgan Stanley | Analysts sought a timeline for volume to return to growth; management consistently deflected to prudence and health over scale. |
| Funding costs and ABS issuance | 3 | CICC, UBS, China Renaissance | Recurring questions on how far funding costs can fall and how the 4x LPR cap affects ABS plans. |
| Overseas expansion | 3 | CICC, China Renaissance, JPMorgan | Analysts asked for concrete progress; management kept answers at the level of market selection and early-stage results. |
Language shifts
Only language evidence verified against the referenced component is shown.
| Observation | Verbatim evidence | Call ID | Component |
|---|---|---|---|
| Early-2025 tone was confident and beat-oriented, before the second-half downturn reset expectations. | “achieved high-quality growth, delivering results that surpassed our expectations” | 1942525283 | 2 |
| By Q4 2025 management flagged portfolio risk at a multi-year peak, the sharpest caution vocabulary in the window. | “increased to 0.97%, the highest recorded since COVID in 2020” | 1988494776 | 2 |
| Capital-return language turned defensive in Q4 2025 as the buyback was effectively paused. | “we take a little bit more cautious view approach for this, just given what's happening in the macro environment” | 1988494776 | 7 |
| One quarter later the buyback tone turned constructive again, tracking the improvement in risk metrics. | “we believe share buyback once again becomes a viable option for shareholder returns at this juncture” | 2000262312 | 7 |
The call history frames the debate cleanly: profits have roughly halved year-over-year and guidance stepped down four quarters running, yet Q1 2026 offers the first hard evidence the risk cycle is turning. The question the transcripts leave open is whether stabilizing asset quality arrives fast enough to offset the pricing and volume management is deliberately giving up, given its own Q2 guidance still implies a roughly 50% year-over-year profit decline.
Qifu Technology: the business and its repricing
Qifu Technology (Nasdaq: QFIN) runs one of China's largest AI-driven consumer-credit platforms, matching 63.6 million credit-approved users with banks. In 2025 it earned ¥6.0 billion (about US$857 million) on ¥19.2 billion of revenue and generated ¥11.1 billion of operating cash — yet its shares have fallen from a 52-week high near US$46 to about US$13, below its own book equity and near twice trailing earnings. This report weighs whether that de-rating is deserved.
Qifu reports in renminbi (RMB). Its stock trades on Nasdaq as an ADS priced in U.S. dollars, and its dividends and buybacks are set in dollars. Figures here are shown in USD for comparability; historical RMB amounts are converted at the roughly RMB 6.99 = US$1.00 convenience rate implied in the FY2025 20-F, and headline figures show the RMB original alongside. Each citation links to the RMB source page.
What the company does
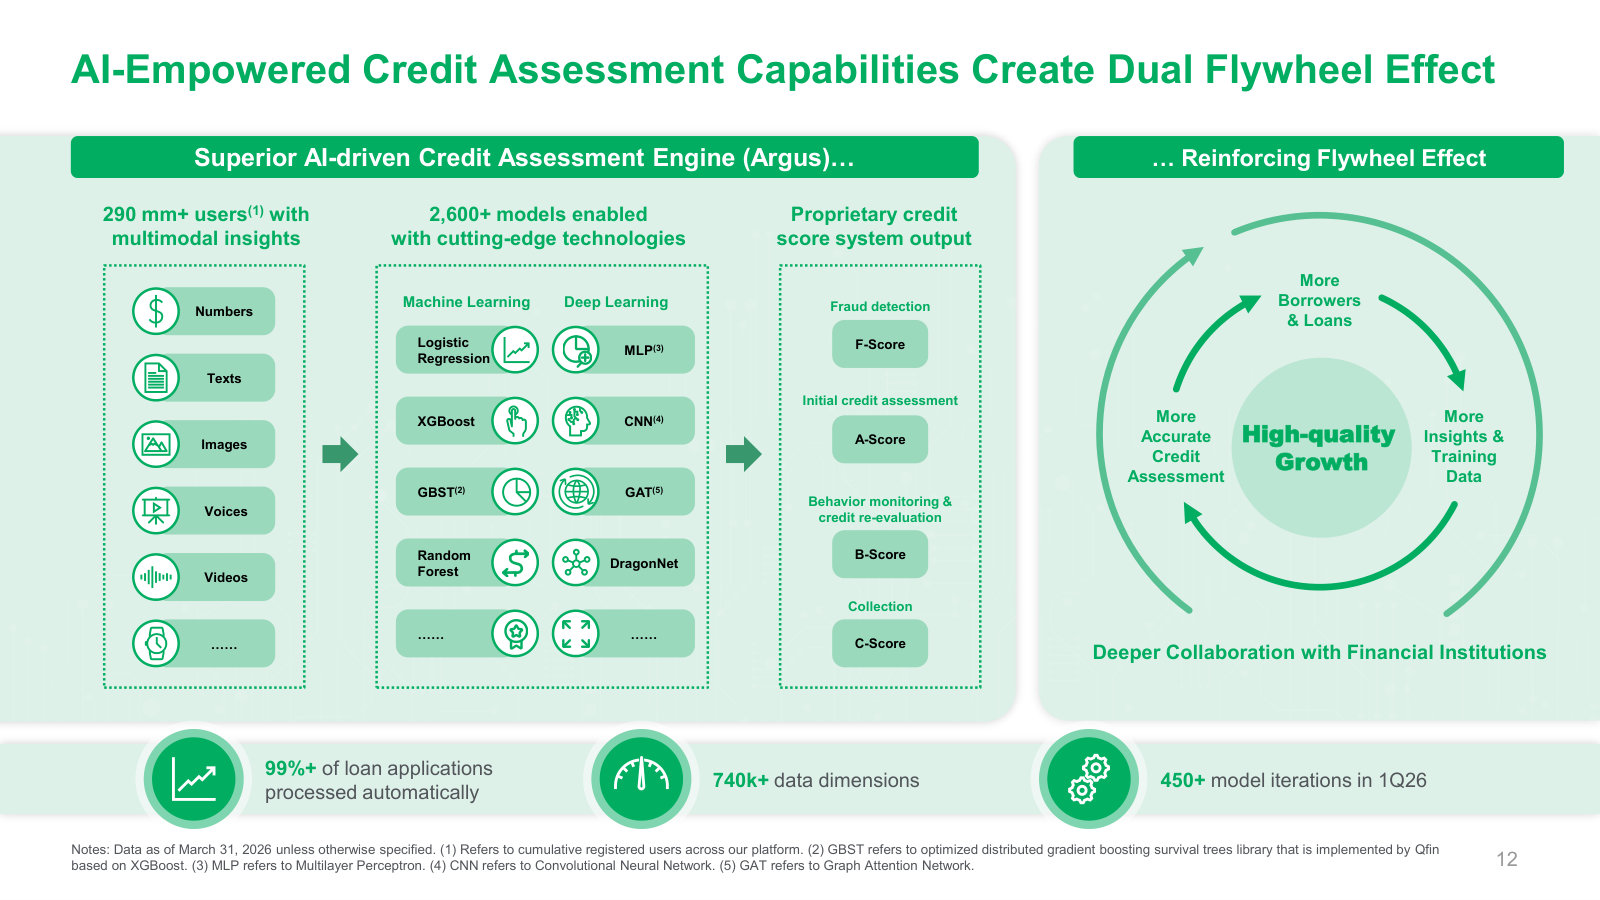
Qifu — known in China as Qifu Jietiao, and formerly listed as 360 DigiTech / Qifu Technology before the 2025 rename to Qfin Holdings [1] — is not a bank. It is a technology platform sitting between borrowers and licensed lenders. Its Argus risk engine screens applicants, and its financial-institution partners supply the funding; Qifu earns fees across the loan lifecycle, from acquisition and credit assessment through servicing and collection [2].
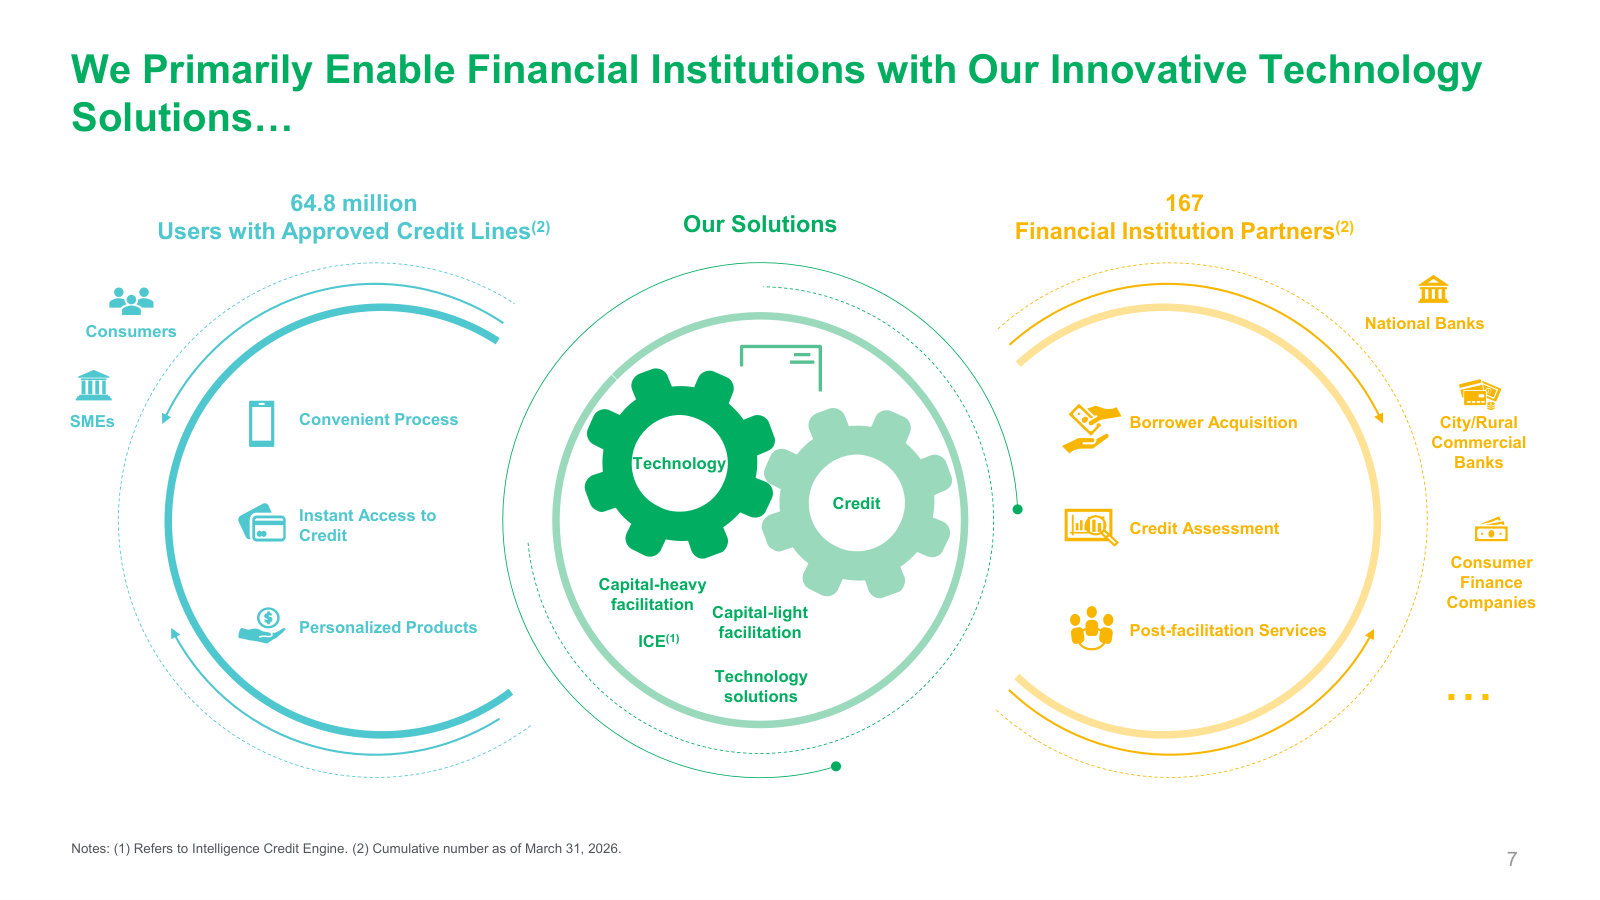
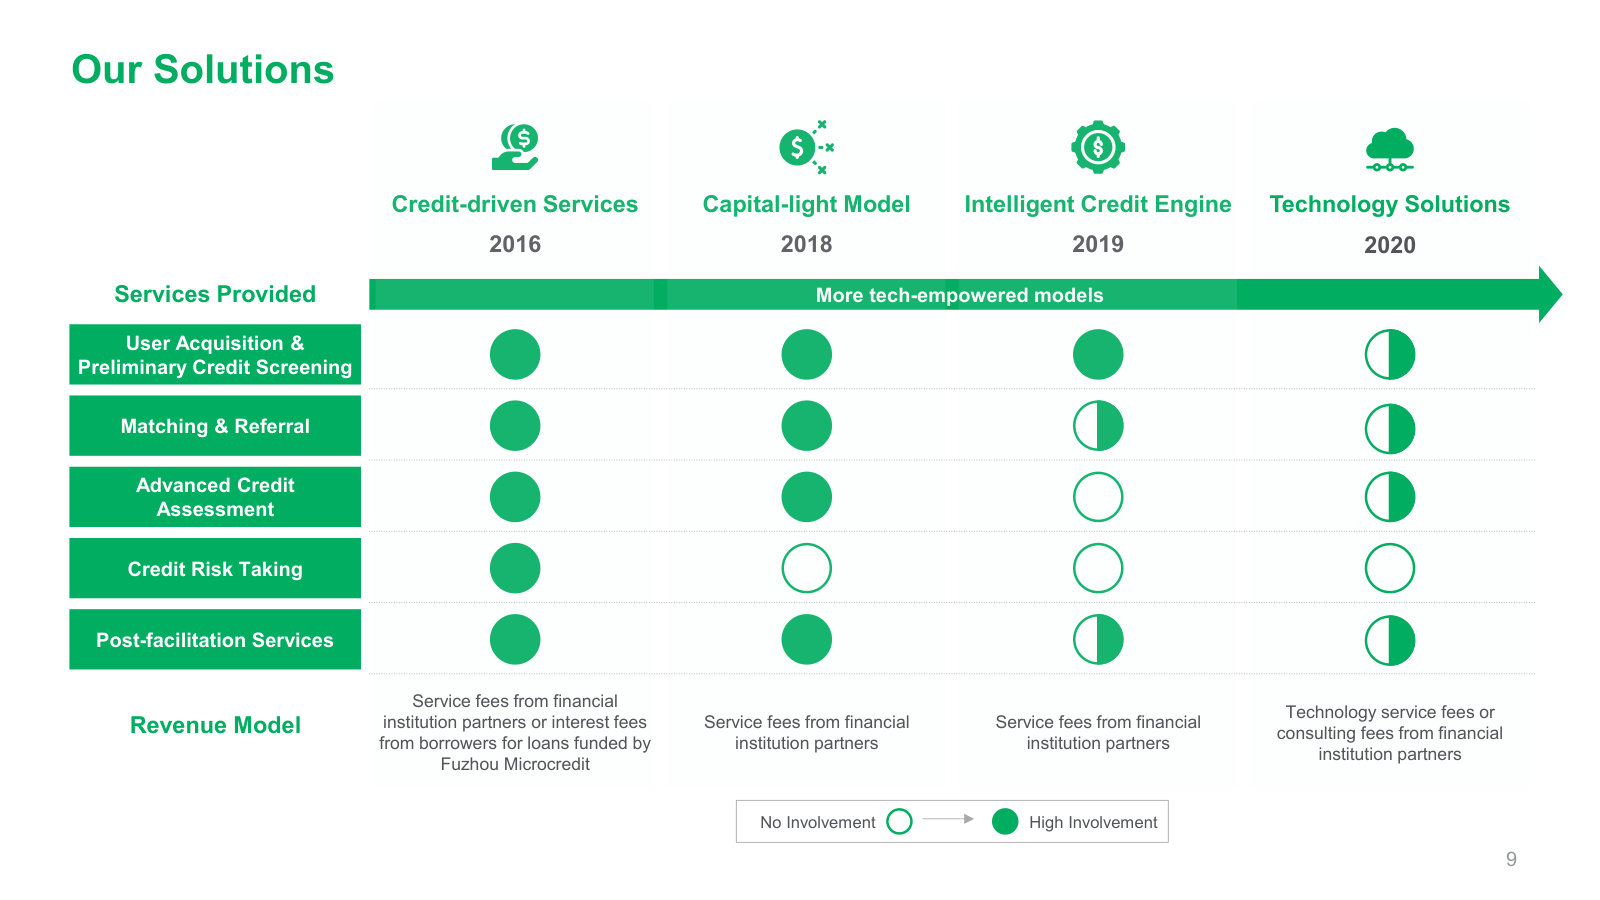
The business runs in two economically distinct modes. Under credit-driven services (capital-heavy), Qifu takes on the credit risk through guarantee or consolidated-trust structures and keeps the spread; under platform services (capital-light, including its Intelligent Credit Engine), it passes borrowers to banks for a fee and bears no credit risk. In 2025 credit-driven services produced ¥14.0 billion of revenue and platform services ¥5.2 billion [3]. Which of these two models the company leans on — and how much credit risk it therefore holds — is a thread later chapters take up.
Loans Facilitated 2025 (US$B)
Loans Outstanding (US$B)
Credit-Approved Users (M)
Repeat-Borrower Revenue
Source: FY2025 Annual Report (Form 20-F), Item 4 Business and Item 5 MD and A [4] [5].
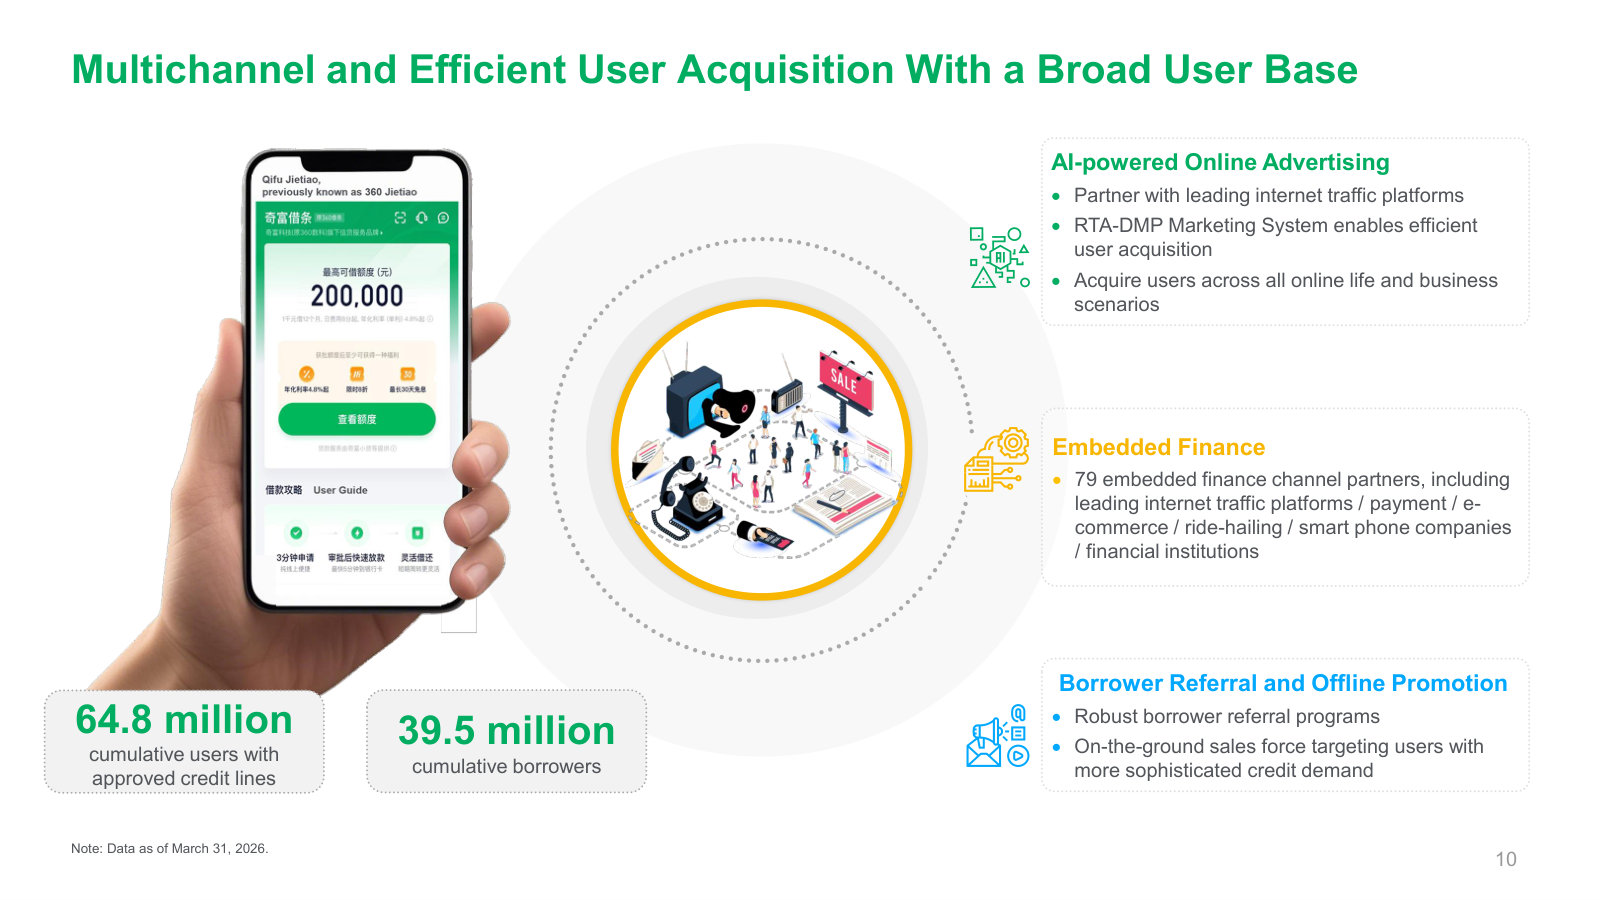
Scale is not the story it once was. Qifu facilitated ¥327.1 billion (US$46.8 billion) of loans in 2025 — a slight rise on 2024 but below the ¥369.1 billion peak of 2023, after management deliberately shrank volume in 2024 to prioritize loan quality amid softening demand [6] [7]. The user base kept growing — 50.9 million approved users at end-2023, 56.9 million at end-2024, 63.6 million at end-2025 — and repeat borrowers supplied 93.3% of 2025 volume, a sign of a sticky, revolving-credit franchise rather than a customer-acquisition treadmill [8].
Source: FY2024 and FY2025 20-Fs, loan facilitation volume; converted at the FY2025 convenience rate [9].
The financial engine
The numbers behind the platform are the reason this is a case worth studying. Revenue grew 12% in 2025 to ¥19.2 billion (US$2.75 billion), and operating cash flow rose 19% to a record ¥11.1 billion (US$1.59 billion) [10] [11]. Return on equity ran near 25% on ¥24.2 billion of book equity [12].
Revenue 2025 (US$B)
▲ 11.9% YoY
Net Income (US$B)
▼ -4.4% YoY
Operating Cash Flow (US$B)
▲ 18.6% YoY
Source: FY2025 20-F, Statements of Operations and Summary Cash Flow Data [13] [14].
One line in that grid does not fit the growth story: net income fell 4% in 2025 even as revenue and cash flow climbed. The reason is provisioning. Qifu added back ¥4.2 billion of credit provisions and ¥1.7 billion of guarantee-liability provisions in 2025, up from ¥3.5 billion and ¥0.5 billion in 2024 — reserves it built against future defaults as the environment tightened [15]. Rising cash and falling accounting profit at the same time is a tension worth marking, because whether those reserves prove conservative or merely timely shapes how much of the reported earning power is real. That question belongs to a later chapter on credit and accounting quality; here it is enough to mark it.
Source: FY2025 20-F, Summary Cash Flow Data (five years); converted at the FY2025 convenience rate [16].
Operating cash flow has risen every year since 2021, nearly doubling over the span. That cash is what funds the capital returns below — and what a buyer at today's price is being handed at a low multiple.
The repricing
QFIN's ADS changed hands around US$13.4 in late July 2026, inside a trailing-twelve-month range of US$11.31 to US$46.18 (Nasdaq market data). The scale of the fall is easiest to see through the company's own convertible notes: in March 2025 Qifu sold US$690 million of 0.50% notes due 2030 with a conversion price of about US$59.71 per ADS [17]. Roughly fifteen months later the stock trades near a fifth of that strike, and the company has been buying the same notes back on the open market — about US$577 million of principal repurchased for US$502 million of cash by late May 2026 [18].
ADS Price (US$)
52-Week High (US$)
Market Value (US$B)
Price / Book (x)
Source: Nasdaq market data (July 2026) and FY2025 20-F book equity of US$3.45B; market value derived from 243.8M ordinary shares (121.9M ADS) [19].
At that price the arithmetic is stark. A market value of about US$1.6 billion sits against US$3.45 billion of book equity — roughly half of book — and against US$857 million of 2025 net income, a trailing multiple close to two times earnings [20]. Even on consensus that expects earnings to fall in 2026, the forward multiple sits in the low single digits. At about US$13.38 the market is pricing 2025 earnings near 1.9 times, an earnings yield above 50%.
Source: Nasdaq daily closing prices, January–July 2026 (month-end sampling); the trailing-twelve-month peak near US$46 predates this window.
The proximate trigger is regulatory. In April 2025 China's National Financial Regulatory Administration issued a notice on internet loan-facilitation, effective October 2025, that introduced a "whitelist" system requiring banks to vet and continuously evaluate the platforms they fund, and required that a borrower's comprehensive financing cost comply with Supreme People's Court rules — effectively a 24% annualized ceiling under judicial protection [21]. Qifu's own first quarter of 2026 was framed by management as delivered "against the backdrop of regulatory tightening," even as it still produced ¥3.9 billion of revenue and ¥2.1 billion of operating cash [22]. How binding the whitelist and the 24% cap actually are — and whether they compress Qifu's take rate or simply thin the field of competitors — are open questions the later chapters take up.
Capital return and who owns it
While the multiple collapsed, Qifu accelerated returns to shareholders. Ordinary shares outstanding fell 14% in a single year, from 284.0 million at end-2024 to 243.8 million at end-2025, and treasury stock rose to ¥4.1 billion [23]. On top of buybacks, a semi-annual dividend set at 20–30% of net income delivered US$0.78 per ADS for the second half of 2025 alone — about 5.8% of the current ADS price for a single half-year [24].
Source: FY2025 20-F, net income per share denominator [25].
Alignment sits on the other side of the ledger. Directors and executive officers together own just 1.1% of the company, and the chief executive holds 0.3%, most of it in options [26]. The largest holder is Aerovane Company Limited at 19.1%, a stake tied to the company's 360-Group heritage, followed by the investment firm Aspex Management at 5.3% [27]. For an investor who weighs insider ownership, the read is mixed: management's own money is barely in the stock, but the aggressive buyback is doing the aligning that direct ownership does not. The structure and motives behind Aerovane's block, and whether the buyback is genuine per-share value creation or balance-sheet management, are worth a chapter of their own.
The question this report answers
Qifu presents a rare split screen: a platform that in 2025 grew revenue, set a cash-flow record, shrank its share count 14%, and pays a double-digit-yielding dividend, whose equity nonetheless trades at roughly half of book and near two times earnings after a 70% fall.
The central question this report weighs is whether QFIN's de-rating reflects a durable impairment of its earning power — from China's tightening loan-facilitation rules, the credit cycle, and the standing discount on U.S.-listed Chinese platforms — or a market misjudging a business that is still compounding cash and retiring its own shares.
The strongest fact for the bears is already on the page: net income fell in 2025 while provisions rose, and consensus expects earnings to keep falling in 2026 — evidence that the earning power itself, not just its price, may be eroding. The strongest fact for the other side is that operating cash and returns to shareholders rose through the same period. Which of these two readings is correct turns on the take rate, the credit book, the regulation, and the trustworthiness of the reserves — the subjects the chapters that follow take up in turn.
How Qifu Turns Volume into Profit
Qifu earns money two ways that look similar on a screen and behave very differently underneath. In 2025, the fee-only side that carries no credit risk shrank, and the growth came from the side where Qifu funds loans on its own balance sheet and keeps the credit risk — financing income alone reached ¥8.6 billion (US$1.2 billion), 44.5% of revenue and the single largest line. That mix shift lifted the reported top line while compressing the profit per unit of volume management steers by, from 5.4% in mid-2025 to below 3% by the fourth quarter. Whether that compression is cyclical or structural is a central question for earning power.
All figures in USD unless noted; historical renminbi (RMB) amounts are converted at the roughly RMB 6.99 = US$1.00 convenience rate implied in the FY2025 20-F, with the RMB original shown alongside headline figures. Take rates, margins, and mix shares are ratios and are currency-independent. Each citation links to the RMB source page.
Two engines, booked very differently
The split established in Business and Repricing — credit-driven (capital-heavy) versus platform (capital-light) — is not just a risk label; it changes how revenue lands on the income statement. Under credit-driven services, Qifu either funds the loan through consolidated trusts and its Fuzhou Microcredit licence (an on-balance-sheet loan) or guarantees an off-balance-sheet loan for a partner bank. On-balance-sheet lending books the borrower's full interest as financing income, gross; the credit losses on those same loans sit lower down as provisions. Guaranteed loans book revenue from releasing of guarantee liabilities. Either way, Qifu holds the credit risk [1].
Under platform services, Qifu passes the borrower to a bank — through its capital-light facilitation model or its Intelligent Credit Engine (ICE) referral channel — and collects a service fee. It takes no credit risk, and the fee is close to pure margin [2]. The consequence matters for anyone reading the growth rate: a renminbi of loan routed on-balance-sheet grosses up revenue far more than the same renminbi routed to a bank for a fee, even though the fee may drop more to the bottom line.
Source: FY2025 20-F, net revenue disaggregation; converted at the FY2025 convenience rate [3].
The mix is intensifying, not lightening
The popular framing of these platforms is a march toward capital-light: more fee income, less balance sheet, less risk. Qifu's 2025 numbers run the other way. Credit-driven revenue rose 19.3% to ¥14.0 billion (US$2.0 billion) and its share of revenue climbed back to 72.7%, while platform revenue fell 4.0% to ¥5.2 billion (US$0.7 billion) [4]. Inside credit-driven, financing income — the purest form of Qifu putting its own balance sheet to work — grew from 38.6% of revenue in 2024 to 44.5% in 2025 [5].
The balance sheet tells the same story from the asset side. Even as the total outstanding book shrank from ¥137.0 billion to ¥126.0 billion, on-balance-sheet loans — the ones Qifu funds and fully owns the losses on — grew from ¥31.9 billion to ¥42.9 billion, lifting their share of the book from 23.3% to 34.0% in a single year, and from 20.1% two years earlier [6].
Financing income as a share of revenue, and on-balance-sheet loans as a share of the outstanding book. Source: FY2025 20-F [7] [8].
By volume the shift is subtler but points the same way: credit-driven services were 55.9% of the ¥327.1 billion facilitated in 2025, up from 47.0% in 2024, while capital-light platform volume fell 15.4% [9]. Some of that is deliberate — management says it dials the mix by cycle, doing more capital-heavy in upturns "generating higher return and higher take rate," and preferring capital-light to offload risk in downturns [10]. Yet 2025 was plainly a downturn, and the mix went heavier, not lighter. The likely reason is defensive: as the April 2025 rules lifted the industry's risk bar, funding for the ICE and referral channels dried up, so volume that once went to partner banks for a fee was pulled onto Qifu's own book to keep it flowing. Referral (ICE) revenue held at ¥2.7 billion for the full year but collapsed to ¥99.7 million in the fourth quarter, down from ¥907.2 million a year earlier [11].
Take rate: the compression
Gross revenue as a share of facilitation volume — a crude take rate — actually rose over the three years, from 4.4% in 2023 to 5.9% in 2025. But that rise is largely the accounting artifact just described: moving loans on-balance-sheet grosses up revenue with interest income while the matching losses sit in provisions. Credit-driven services carry roughly twice the gross revenue take rate of platform services precisely because they book gross interest, not a net fee.
Segment revenue divided by segment loan-facilitation volume. Source: derived from FY2025 20-F revenue [12] and volume [13].
The take rate management actually steers by — a net measure after funding and risk — tells the opposite, and more important, story. It was 5.4% in the second quarter of 2025, up almost a point year-over-year [14]. By the fourth quarter it had fallen to 3.5% on a headline basis and, excluding one-off items, "slightly below 3%," with management now aiming only to "maintain a take rate of about 3%" if the regulatory environment holds [15]. A business whose per-unit economics move from above 5% toward 3% inside two quarters is repricing its own earning power in real time.
The profit line shows it plainly. Fourth-quarter 2025 net income was ¥1,016.1 million, down 47% from ¥1,912.7 million a year earlier, and the GAAP net income margin fell to 24.8% from 42.7% [16].
Take Rate Q2 2025
Take Rate Q4 2025
Net Margin Q4 2025
▼ -17.9% vs Q4 2024
Management-stated quarterly take rate and GAAP net income margin. Sources: Q2 2025 call [17]; Q4 2025 call [18]; Q4 2025 results [19].
Where the compression goes: gross-up and provisions
Because more of the book sits on Qifu's balance sheet, both revenue and cost lines inflate together. The provision for loans receivable — the reserve against on-balance-sheet defaults — rose to ¥3.6 billion in 2025, 18.9% of revenue, from 16.2% in 2024, and the provision for contingent liabilities on guaranteed loans jumped to ¥1.7 billion from ¥0.5 billion [20]. This is the mechanical reason, first flagged in Business and Repricing, that record revenue and record operating cash flow in 2025 coincided with net income slightly down: the intensifying balance sheet grosses up the top line and the reserve build at the same time.
The asset quality behind those reserves has turned. The 90-day-plus delinquency rate rose to 2.71% at end-2025 from 2.09% a year earlier, which management attributes to macro uncertainty and the 2025 regulatory changes [21]. The leading edge was sharper still: the fourth-quarter Day-1 delinquency rate was 6.1% and the 30-day collection rate 84.1% [22].
Watch item: as on-balance-sheet loans rose to 34% of the book, the 90 day-plus delinquency rate rose to 2.71% and the net take rate fell toward 3%. More of the earnings now depend on credit outcomes Qifu owns directly, at the moment those outcomes are deteriorating.
The counter-case, and what would settle it
The bearish read — that a 3% take rate on a shrinking, riskier book is the new normal — is not the only one the evidence supports. Management frames capital-heavy lending as the higher-return option, and funding costs are a tailwind: they fell to 2.9% of revenue in 2025 from 4.0% in 2023 as deposit rates eased and Qifu diversified into asset-backed issuance [23]. The first quarter of 2026 offered a tentative inflection: excluding one-off items, the take rate improved sequentially, and FPD7 — an early-warning indicator for new loans — fell roughly 20% versus the prior quarter as tighter underwriting worked through [24]. And the franchise itself is intact: repeat borrowers still supplied the overwhelming majority of volume — 93.3% for full-year 2025 — so the compression is in pricing and risk, not in customer loss [25].
The read here: the take-rate compression is real and mostly regulatory-and-cycle-driven rather than a permanent impairment, but the shift onto Qifu's own balance sheet raises the stakes on being right about credit. A stable take rate near 3% on ¥327 billion of volume still supports meaningful profit; a take rate that keeps sliding while delinquencies climb would not. What would settle it, over the next few quarters: whether the net take rate holds at or above management's ~3% target, and whether the delinquency and FPD7 improvement seen early in 2026 persists as the tighter-underwritten vintages season. The provisioning question those reserves raise — conservatism or early warning — belongs to a dedicated look at credit and accounting quality.
The Estimate Behind the Reserves
Qifu keeps three separate credit reserves, and all three are driven by one internal number: the expected default rate on its loan book. Deloitte flags that single estimate as the only critical audit matter in the FY2025 audit. It sets the allowance on Qifu's own loans, the reserve behind its loan guarantees, and — through variable consideration — part of revenue itself. The estimate is being made as the book deteriorates: 90-day+ delinquency rose to 2.71% and loan charge-offs reached ¥3.2 billion. The 2024 "record" profit leaned on an unusually light provisioning year; 2025's dip is largely that reversing.
Figures are in renminbi (RMB, ¥) with the FY2025 20-F's own US$ translations at the ¥6.99 = US$1.00 convenience rate shown alongside headline amounts; ratios are currency-independent. Each citation links to the RMB source page.
One estimate, three places it lands
The unit-economics picture (Unit Economics) established that Qifu's growth now comes from loans it either funds itself or guarantees — in both cases keeping the credit risk. That risk shows up in four provision lines on the income statement: a provision for loans receivable (on-balance-sheet loans), a provision for financial assets receivable and a provision for contingent liabilities (both tied to guarantees on off-balance-sheet loans), and a provision for accounts receivable and contract assets [1].
Underneath the four lines sits a single judgment. Deloitte identified exactly one critical audit matter for 2025: "the estimate of expected default rate," which the company uses to value its stand-ready guarantee liabilities (a discounted-cash-flow model), its contingent guarantee liabilities (an expected-credit-loss model), and its allowance for loans receivable. The rate is estimated "on a pool basis according to the historical net default rate by vintage," adjusted for industrial and macroeconomic factors. Deloitte needed its own fair-value specialists to test it [2]. The company describes the same machinery in its critical accounting estimates: default rates built from historical vintage curves, then adjusted for CPI, money supply and delinquent-loan collection rates [3].
Because the reserves and part of revenue are most sensitive to one input, the disclosed sensitivity is the cleanest way to size the judgment. A 0.5-percentage-point move in the estimated default rate would change the loan-loss allowance by ¥459.4 million (US$65.7 million) and the contingent guarantee liability by ¥294.2 million (US$42.1 million) — ¥753.6 million (US$107.8 million) together, before tax [4]. Against ¥5,989.7 million (US$856.5 million) of 2025 net income, that half-point is worth roughly an eighth of a year's after-tax profit [5]. A year earlier the same half-point moved ¥694.0 million; the sensitivity has grown as the on-balance-sheet book has [6].
The two reserves the critical audit matter names, with the disclosed effect of a half-point change in the estimated default rate. Source: FY2025 20-F, critical accounting estimates [7].
The provisioning cycle reframes the profit line
Taken as a group, the four provisions total ¥5.77 billion in 2023, then drop to ¥3.97 billion in 2024, then climb back to ¥5.85 billion (US$836.1 million) in 2025 [8]. Net income traces the mirror image: ¥4.29 billion in 2023, a record ¥6.26 billion in 2024, then ¥5.99 billion in 2025 [9]. The 2024 peak coincided with the lightest provisioning of the three years.
The swing sits almost entirely in one line. The provision for contingent liabilities — the reserve Qifu builds against guarantees it may have to honour — was ¥3.05 billion in 2023, collapsed to ¥478.4 million in 2024, and rebuilt to ¥1.67 billion (US$238.5 million) in 2025 [10]. Management's own bridge is blunt: operating costs and expenses rose from ¥9.64 billion to ¥12.53 billion in 2025 "primarily due to the increase in provision for contingent liabilities and increase in provision for loans receivable" [11].
The four credit-related provision lines. The contingent-guarantee line (red) collapses in 2024 and rebuilds in 2025. Source: FY2025 20-F, costs and expenses [12].
Two readings compete, and both have support. On one side, the low 2024 provision partly reflects a shrinking guarantee book rather than a deliberate release: the contractual balance of loans Qifu guarantees fell from ¥24.8 billion to ¥22.4 billion over 2025, and fewer new guarantees mean less to reserve against [13]. On the other, new guarantee origination did not shrink in 2025 — the stand-ready guarantee liability provisioned at inception actually rose from ¥2.35 billion to ¥3.55 billion — yet the contingent provision more than tripled, which points to a higher assumed loss rate on new business, not just more of it [14]. The reasonable read is that 2024's record was flattered by a benign default assumption, and 2025 is closer to a through-cycle provisioning level — which means the earnings base the market de-rated from was softer than the 2024 headline suggested.
Delinquency and charge-offs are rising; coverage is holding
The reserve build is not conservatism on a stable book. The overall 90-day+ delinquency rate fell to 2.09% at the end of 2024 but rose to 2.71% at the end of 2025, which management attributes to macroeconomic uncertainty and the April 2025 regulatory changes [15]. On the on-balance-sheet book, gross loan charge-offs climbed from ¥1.84 billion (2023) to ¥2.42 billion (2024) to ¥3.20 billion (US$457.1 million) in 2025, and the loan-loss allowance rose to ¥3.63 billion; net of ¥506.9 million of recoveries, net charge-offs ran near ¥2.7 billion on an average book of about ¥37 billion — a roughly 7% net loss rate [16].
Year-end 90-day+ delinquency, plus 31 March 2026. Sources: FY2025 20-F [17]; Q1 2026 results [18].
Whether the reserves are keeping pace is the point a skeptic presses, and the answer is mixed. On the on-balance-sheet book, the allowance as a share of gross loans barely moved — 8.4% at end-2024 to 8.6% at end-2025 — even as delinquency and charge-offs rose faster than that [19]. On the guarantee book, coverage rose more, from 7.3% to 8.4% of the guaranteed balance, so that reserve was rebuilt harder [20]. A high-yield, short-duration consumer book can carry a ~7% loss rate if pricing covers it, so the level is not alarming on its own; the direction is what warrants attention, and the on-balance-sheet allowance is the line where the cushion thinned relative to the deterioration.
The same dial also sets part of revenue
The default-rate estimate does not only build reserves — it feeds the top line. Qifu recognises loan-facilitation revenue using an estimated transaction price that includes variable consideration tied to future default and prepayment; when prior vintages perform better than modelled, the fee rate re-estimates upward and revenue is booked. In 2025 that catch-up added ¥1,374.5 million (US$196.5 million) of revenue "from performance obligations satisfied (or partially satisfied) in prior periods" — about 7% of total net revenue [21]. In 2024 the equivalent adjustment was disclosed as "not significant" [22].
That creates a tension worth naming plainly. The same estimation machinery was pushing reserves higher (a more cautious default view on the current book) while releasing ¥1.4 billion of revenue from favourable re-estimates of older vintages. The two are not contradictory — older, largely run-off vintages can perform better than newer ones being written into a tougher market — but they sit on opposite sides of one judgment, and a single set of assumptions determines both how much Qifu reserves and how much it earns. For a company already trading near book value on falling profits, the quality of that one estimate carries unusual weight.
What would decide it, and what to watch
The evidence does not settle the durability question by itself; it sharpens it. The reserve build is real and the book is deteriorating on the lagging measure, which argues that 2025's lower profit reflects genuine credit cost rather than accounting caution alone. But coverage ratios rose rather than fell, and the leading indicators turned up early in 2026 — the Chief Risk Officer reported Day-1 delinquency easing to 5.7% and the 30-day collection rate improving to 85.8% in the first quarter, with legacy loans running off [23]. The lagging 90-day+ rate, which the company itself calls "a backward looking indicator," kept climbing to 3.50% at 31 March 2026 precisely because it reflects loans that soured a quarter earlier [24] [25]. Whether 2025 proves a provisioning trough or the first leg of a longer deterioration turns on which of those signals dominates as the pre-cap vintages run off.
Three lines make that check falsifiable. The provision for contingent liabilities (¥1.67 billion in 2025) and the provision for loans receivable (¥3.63 billion) are disclosed each quarter; a further step-up would confirm the deterioration read, a fade would confirm the trough. The on-balance-sheet allowance ratio (8.6%) should rise if delinquency keeps climbing; a flat ratio against a rising 90-day+ rate is where under-reserving would first appear. And the disclosed sensitivity — ¥753.6 million per half-point of default rate — is the multiplier on any of it. What cannot be independently checked is the estimate itself, which is why Deloitte singled it out.
The April 2025 rules and where they land
The April 2025 loan-facilitation notice is the event the market pinned the de-rating on, so it is worth separating what it actually changes from what it merely names. Its headline provision — an effective 24% cap on a borrower's comprehensive financing cost — is a threshold Qifu already crossed years ago: it repriced its entire book below 24% by early 2022 and ran a 20.9% average APR in the third quarter of 2025. The rules bind through a different channel — access to bank funding via a new "whitelist," and the liquidity squeeze that arrived with them — and that channel is visibly biting.
Figures are in renminbi (RMB) with U.S.-dollar equivalents at the roughly RMB 6.99 = US$1.00 convenience rate in the FY2025 20-F; pricing, funding shares, and growth rates are percentages and unitless. Each citation links to the RMB source page.
A pricing cap Qifu already cleared
When 360 Finance — Qifu's former name — filed to list in 2018, its loans ranged from 9% to 36% APR, and most of the book sat above what would become the binding line: 43.4% of loans by outstanding balance were priced above 24% at the end of 2017, rising to 67.4% by September 2018 [1].
Source: 2017–2018 shares of outstanding balance above 24% per the 2018 Form F-1 [2]; the 2022+ figure reflects management's statement that all new loans were priced below 24% by Q1 2022 [3].
The transition ran from 2021 to early 2022. Average portfolio pricing was 27.2% in the second quarter of 2021, and management's stress test assumed a steep cut to below 24% from September 2021, concluding it "should still be able to maintain healthy growth and profitability in the transitional year of 2022" [4]. By the first quarter of 2022 it reported that "all new cap heavy and cap light loans are already priced below 24%" and was "very confident to achieve the rate cap requirement ahead of the regulatory deadline" [5]. By the third quarter of 2025 — six months after the new notice — Qifu's average APR was 20.9%, with room beneath the cap [6].
That history matters for reading the 24% provision. The relevant caveat is definitional: the notice specifies a comprehensive financing cost — the all-in rate a borrower pays, including guarantee and credit-enhancement fees, not the funding-partner interest alone [7]. Qifu already presents its price to the borrower as a single APR inclusive of those fees, and at 20.9% that all-in number sits inside the cap. The pricing dimension of the April 2025 rules is, for Qifu, largely a formalization of a shift it completed three years ago.
What the notice actually changes
The National Financial Regulatory Administration's April 2025 notice, effective October 1, 2025, has three operative parts as Qifu itself summarizes them: a "whitelist" management system requiring commercial banks to run comprehensive due diligence and continuous evaluation of their facilitation partners; the 24% comprehensive-cost requirement above; and a mandate that banks terminate cooperation with agencies that fail compliance standards or use improper collection practices [8].
The first prong is the load-bearing one. A whitelist converts bank partnership from a commercial decision into a compliance gate: "if we fail to be included or maintained on the whitelist of our partnering commercial banks … our financial institution partner may cease their cooperation with us" [9]. Qifu's funding is concentrated enough for that to matter: its top five direct financial-institution partners supplied about 35.1% of total funding for the loans it originated and facilitated in 2025 [10]. The company frames the whitelist itself as a risk, warning that failing to stay on partners' lists would leave "our access to funding from these financial institutions … significantly curtailed" [11].
Avg APR (Q3 2025)
Comprehensive Cap
Top-5 Banks / Funding
FIs Served (cum.)
Sources: average APR and funding mix, Q3 2025 earnings call [12]; top-five funding share, FY2025 20-F [13]; institutions served, Q4 2025 earnings call [14].
Funding access, not price
The clearest evidence of where the rules bite is the collapse of Qifu's referral channel. Its Intelligent Credit Engine — the capital-light service that hands qualified borrowers to third-party lenders for a pure fee — saw referral service fees fall about 85% quarter-on-quarter in the fourth quarter of 2025, and ICE volume drop 41% quarter-on-quarter to roughly 20% of total loan volume [15]. Management attributes it directly to the rules: "as the entire industry is lifting the risk bar, funding capacity for our ICE and referral businesses will come down. This means some users will no longer be served, and this will have some impact on our loan volume" [16]. This is the mechanism behind the balance-sheet intensification traced in Unit Economics: as the fee-light referral spigot narrowed, volume migrated onto Qifu's own book.
The rules also arrived alongside a broader liquidity squeeze. Management describes 2025 as a "systemic restructuring" of China's consumer-finance industry — new facilitation rules, window guidance for consumer-finance companies, and comprehensive-cost guidelines for micro-lenders together "tightened market liquidity, which in turn suppressed credit demand and put unprecedented pressure on both loan growth and risk management across the industry" [17]. Separating the two is hard, but the demand-and-liquidity channel — not a fresh repricing — is what management says drove the fourth-quarter pressure.
One constraint is worth sizing precisely because it is smaller than it looks. Informal window guidance on consumer-finance-company pricing has circulated, but those companies supply only about 15% of Qifu's funding mix; most of its funding comes from banks, leaving it "flexible to shift our funding structure if needed" [18]. The direct pricing exposure is contained; the funding-access and demand exposure is not.
Qifu names diversified funding as a core competitive advantage — 167 bank partners, ¥67.6bn of ABS/ABN at a 3-4% cost, and a micro-lending licence self-funding 21.2% of 2025 drawdowns — yet the bank-partnership majority of that stack (top-five partners alone are 35.1% of funding) runs through the same whitelist channel the April 2025 rules gate, a bind already visible in a 41% quarter-on-quarter fall in ICE volume and an 85% drop in referral fees in the fourth quarter of 2025.[29][30][31]
An industry rule, and who it favors
This is a sector-wide reset, not a Qifu-specific action. Peers describe the identical notice: Yiren Digital details the same whitelist, comprehensive-cost, and fee-transparency requirements [19], and Xiaoyu/X Financial notes that "in practice a 24% annual cap on total borrowing costs is generally implemented and enforced" across the industry [20]. Because the constraint is common, its competitive effect is relative, and management's read is that it favors scale: "smaller players without such advantage will gradually exit the market, allowing the stronger ones to capture a larger share" — Qifu counts itself among the stronger, calling the rules "a positive for the industry" [21]. It served 167 financial institutions cumulatively at end-2025 [22], a partner base wide enough that a single whitelist exclusion is unlikely to be existential — though the 35.1% top-five concentration means several would sting.
The table below sorts the notice by channel and by how hard each presses on Qifu specifically.
Sources: comprehensive-cap and whitelist provisions, FY2025 20-F [23] [24]; pricing and ICE data, Q3–Q4 2025 calls [25] [26].
The judgment, and what would change it
On the evidence, the April 2025 notice is better read as an accelerant of an industry consolidation than as a fresh cap that impaired Qifu's pricing. The pricing shock the market appears to have feared was absorbed in 2021–2022; what the rules do now is squeeze funding access and near-term demand, which shows up as lost ICE volume and a book pulled onto Qifu's own balance sheet rather than as a repricing of the whole loan portfolio. On the same facts, management's "positive for the industry" framing is the more self-serving read: the near-term cost is real and quantified — a 41% quarter-on-quarter fall in ICE volume is not a rounding error — and the long-run benefit of consolidation is an assertion, not yet a number.
Two things would change this read. The first is confirmation of whitelist status: Qifu has not disclosed inclusion on its partners' lists, and a material exclusion would move the funding-access constraint from medium to high. The second is the still-forming rulebook. The disclosure regime keeps tightening — the March 2026 Provisions on explicit disclosure of comprehensive financing cost take effect in August 2026 [27], and Qifu flags an April 2026 measure on online marketing of financial products effective September 30, 2026 [28]. A formal — rather than informal — pricing rule for consumer-finance funding partners would be the item that reopens the pricing question this chapter otherwise sets aside.
What the price implies, and what protects it
At US$13.38 the market values Qifu's equity at roughly US$1.6 billion — about 0.47 times its US$3.45 billion book and near twice trailing earnings. On its face that is a wide margin of safety. This chapter tests whether it is one, and the test starts with a dependency that runs underneath both the asset value and the earnings.
Qifu reports in renminbi (RMB); its ADSs trade on Nasdaq in U.S. dollars, and its dividends and buybacks are set in dollars. Figures here are shown in USD for comparability, with the RMB original alongside for headline items; historical RMB is converted at the roughly RMB 6.99 = US$1.00 rate the FY2025 20-F uses. Each ADS represents two Class A ordinary shares. Every citation links to the RMB source page.
The asset floor is not independent of the earnings risk
Qifu trades at 0.47x book (US$1.63bn market value vs US$3.45bn equity) and ~1.9x trailing earnings, yet both the book and the earnings are set by a single unverifiable input — the expected-default estimate Deloitte named its sole 2025 critical audit matter — whose 0.5-percentage-point move swings reserves by RMB753.6m (~13% of the RMB5,989.7m net income), so the asset floor is not independent of the earnings risk it is meant to cushion, and only ~US$74m of the group's cash sits at the listed parent. [1] [2] [3] [4] [5].
A margin-of-safety buyer usually leans on two separate cushions: the earnings are cheap, and if the earnings disappoint the book value is still there underneath. Here they are not two cushions but one. Book equity is dominated by the on-balance-sheet loan book and the guarantee reserves, all carried off the single expected-default estimate (Reserve Quality); the reported earnings are what remains after that same estimate sets the year's provisions. A sustained half-point rise in the assumed default rate lifts reserves by RMB753.6 million (US$107.8 million) before tax — about an eighth of 2025's RMB5,989.7 million (US$856.5 million) net income [6] [7] — and takes the same amount off book equity. It raises the 0.47x price-to-book and the ~1.9x price-to-earnings in the same motion. A few half-points, sustained, move both together, which is why the asset-based and earnings-based margins of safety are the same margin counted twice.
The strongest fact against this reading sits in the same breath. The estimate is examined, not merely asserted: Deloitte tested it with its own fair-value specialists before signing the audit [8], reserve coverage rose rather than fell across 2025 (Reserve Quality), and the RMB753.6 million is a hypothetical sensitivity, not a realized loss — 2025's actual charge-offs were absorbed with the book still profitable. The dependency is a reason the discount is not free money; it is not evidence that the floor has already given way.
The setup: cheap on every conventional metric
Qifu ended 2025 with 243,823,900 Class A ordinary shares outstanding — about 121.9 million ADSs after the two-for-one ratio [9]. At US$13.38 that is a market value near US$1.63 billion, against US$3.45 billion (RMB24.11 billion) of book equity attributable to shareholders [10]. Book value works out to about US$28.3 per ADS; the shares trade at 0.47 times it. On US$857 million (RMB5.99 billion) of 2025 net income, the trailing multiple is roughly 1.9 times [11].
ADS Price (US$)
Market Value (US$B)
Price / Book (x)
Trailing P/E (x)
Source: ADS price 27 Jul 2026 (Nasdaq market data); shares and book equity from FY2025 Annual Report (Form 20-F), Consolidated Balance Sheets [12]; net income from Consolidated Statements of Operations [13]. Ratios derived.
That is not a lonely reading. Sell-side coverage sits at four strong-buy, seven buy and two hold, with a mean price target of US$21.9 and a median of US$22.6; even the single lowest target, US$14.6, sits above the current quote. What the shares imply, then, is sharply at odds with the analysts who follow them.
What the discount is priced against
Two things back the low multiple: a pile of liquid capital and a large, active return of cash to holders.
On the asset side, Qifu closed 2025 with US$672 million (RMB4.70 billion) of cash and US$408 million (RMB2.85 billion) of short-term investments, against US$372 million (RMB2.60 billion) of convertible notes — roughly US$0.71 billion of net liquid assets, about 43% of the entire market value, before counting the RMB38.7 billion on-balance-sheet loan book or the rest of book equity [14].
Source: FY2025 Annual Report (Form 20-F), Consolidated Balance Sheets; net liquid = cash + short-term investments − convertible notes [15]. Market value at US$13.38, 27 Jul 2026.
On the return side, the flow is unusually large for the market cap. In 2025 Qifu spent US$693 million (RMB4.85 billion) buying back ADSs and paid US$192.4 million (RMB1.38 billion) in dividends — close to US$0.9 billion, or about 54% of today's market value, returned in a single year [16] [17]. The buyback ran across escalating programs — US$150 million in the year to March 2024 at an average US$16.02 per ADS, US$350 million to end-2024 at US$23.14, and US$450 million through 2025 at US$28.20 [18]. The dividend follows a policy of paying out 20–30% of each half-year's after-tax profit; the board declared US$0.78 per ADS for the second half of 2025, and the trailing dividend alone runs near 12% of the price [19].
Source: FY2025 Annual Report (Form 20-F) — dividends paid p.14 [20]; repurchase programs p.196 [21]; 2025 buyback is the cash-flow figure and includes ~US$227M funded by 2030 Notes proceeds [22].
The convertible is its own small case study in capital allocation. Qifu issued US$690 million of 0.50% notes due 2030 in March 2025, struck at a US$59.71 conversion price (later adjusted to US$57.06) — far above the shares then or now, so the dilution risk is remote [23]. It then used the proceeds to buy stock and, subsequently, to retire the notes themselves: by March 2026 it had repurchased about US$460 million of principal for US$399 million in cash — a ~13% discount to par that booked a US$39 million gain — leaving only US$230 million outstanding [24]. A feared overhang was converted into a shrinking, accretively-retired liability.
That engine did not run at the 2025 pace into the new year. Having returned ~US$0.9bn to holders in 2025 (about 54% of market cap), Qifu paused its share buyback in the first quarter of 2026 — repurchasing only US$577m of convertibles for US$502m of cash — while reported net income fell 51% year-over-year to RMB879.8m and 90-day-plus delinquency rose to 3.50% from 2.71%, even as the company still generated RMB2.1bn of operating cash and cut leverage to 2.4x. [25] [26] [27] [28] [29] [30]. Management frames the pause as opportunistic rather than forced — the dividend continued, operating cash stayed positive, and leverage fell — so the read is caution and debt reduction, not distress; the buyback that anchored the mispricing case simply went quiet as the credit cycle turned, and its resumption at today's sub-book price is what would convert the discount into per-share value (Leading vs Lagging).
Put together, the price implies a trailing earnings yield above 50%. Even on consensus, which looks for a roughly 37% drop in 2026 net income, the forward multiple is only about 3 times and the forward yield near a third [31]. For a buyer of very cheap companies, that is the case for mispricing: even flat-to-falling earnings, returned at this rate, compound a large return from here.
Trailing Earnings Yield (%)
Forward P/E, 2026E (x)
Trailing Dividend Yield (%)
2025 Cash Returned / Mkt Cap (%)
Source: derived from FY2025 net income and balance sheet [32]; 2026E applies consensus −37% net-income growth (yfinance analyst estimates, 6 analysts). Forward P/E and yields derived.
The case against the margin of safety
A disciplined value buyer should still weigh why the discount may be earned rather than mistaken, because the remaining supports are softer than they look.
The earnings are cheap against a flattering base. The 1.9-times multiple is struck on a 2025 profit that itself declined, and on a 2024 record that leaned on the lightest credit provisioning of three years — a point developed in Reserve Quality. Consensus expecting a further ~37% fall in 2026 is consistent with that: the take rate management steers by compressed toward the low-single digits by the fourth quarter of 2025, as shown in Unit Economics, and the binding channel of the new loan-facilitation rules — bank-funding access — is still working through, per Whitelist Regime. Two times a normalizing number is a materially higher multiple than two times a peak one.
Most of the book and cash sit onshore, subject to capital controls. Qifu is a Cayman holding company whose profits are earned in renminbi inside PRC subsidiaries and variable-interest entities. At the listed-parent level, cash was only RMB518.9 million — about US$74 million — at end-2025; the rest must be moved up through dividends that are subject to PRC currency controls and a 5% withholding rate under the Hong Kong treaty (10% without it) [33] [34]. Part of the sub-book price is compensation for that structural friction, not pure mispricing.
And the buyback, for all its scale, was executed at US$16 to US$44 per ADS — above today's price and, at the top of that range, above book value [35]. Capital was returned, but the per-share value capture from those repurchases was modest; the accretion argument only becomes powerful at prices like the current one.
The counter to the counter is that none of this is fatal. Qifu demonstrably did move roughly US$0.9 billion to holders in 2025, so repatriation is a toll, not a wall; the note repurchases were genuinely accretive; and buybacks struck below book from here would, at last, create per-share value rather than merely distribute it.
Where that leaves the value
The equity is cheap on every conventional metric, and the return-of-capital engine behind it is real and sizeable. The evidence points to a genuine discount rather than a pure trap — but a discount that is compensation for real risk, not a free option. The margin of safety is thinner than 0.47 times book and 1.9 times earnings suggest, because the earnings are measured against a flattering base, the book leans on the same credit estimate as the earnings, and the cash carries a repatriation cost. What would move the read toward mispricing is a stabilizing 2026 earnings base — the take rate and delinquency inflecting, tentatively visible in early 2026 — together with continued unobstructed distributions. What would confirm the trap is a deeper credit down-leg that pulls earnings and book down together, or an obstruction to getting the cash out. On the latest data the discount looks earned but not fatal, and which way it resolves turns on the credit path from here.
Scale and Moat
Qifu is the largest of China's listed credit-tech facilitators, and its lead is measured, not asserted: in 2025 it facilitated more loan volume than the next peer by half again, and earned more than twice the net income of the second-most-profitable. That scale — not a secret in the risk model — is the moat. It buys cheaper funding, more borrower data, and wider distribution, and a regulatory cull is thinning the sub-scale field beneath it. The edge is narrow, though: the technology claim is unprovable, and the funding access it rests on is exactly what regulators now gate.
The valuation case (Margin of Safety) depends in part on whether the earning power behind the cheap multiple is durable. This chapter examines that question: whether Qifu is a genuine franchise or a well-run participant in an industry whose favourable conditions may not persist.
Where the moat is narrow
Qifu names diversified funding as a core competitive advantage — 167 bank partners, ¥67.6bn of ABS/ABN at a 3-4% cost, and a micro-lending licence self-funding 21.2% of 2025 drawdowns — yet the bank-partnership majority of that stack (top-five partners alone are 35.1% of funding) runs through the same whitelist channel the April 2025 rules gate, a bind already visible in a 41% quarter-on-quarter fall in ICE volume and an 85% drop in referral fees in the fourth quarter of 2025. [1][2][3]
The advantage is real, but it is neither unassailable nor independent of the risks the earlier chapters laid out.
The technology claim is the softest part. Every peer in the table asserts an "industry-leading," proprietary risk model of its own; the label is unfalsifiable, and the only external proof is realized credit performance. Qifu's is better than its two large peers — but the gap is thin (2.71% versus 2.85–3.1%), and its own delinquency still rose from 2.09% to 2.71% over the year [4]. The model dampens the credit cycle; it does not defy it. Borrower switching costs are low, too — these are revolving, unsecured lines, and the 93.3% repeat rate measures the loyalty of borrowers who stay, not exclusivity from a market where multi-platform borrowing is routine.
The more structural limit is that the funding advantage — the most durable of the scale advantages set out below — runs through the exact channel regulators now control. Qifu itself frames "our deep understanding of users, robust credit assessment… and broad and diversified funding sources" as its competitive edge [5]. But the whitelist regime (Whitelist Regime) is precisely a gate on which platforms banks may fund. Scale improves the odds of clearing that gate, and the 2025 cull rewards compliance leaders — yet the moat's most valuable input is granted by policy, not owned outright. That makes the franchise contingent on regulatory standing in a way a pure network or brand moat would not be.
The scale lead, in numbers
Qifu facilitated ¥327.1 billion (US$46.8 billion) of loans in 2025, on a cumulative base of ¥2,539.1 billion to 38.9 million borrowers, with 63.6 million users holding approved credit lines [6][7]. Against the five closest listed peers — all Chinese loan-facilitation platforms that match funders to borrowers — that is the largest volume in the set, ahead of LexinFintech's ¥205 billion and FinVolution's ¥200.3 billion, and roughly five times Yiren Digital's ¥67.8 billion.
Sources: QFIN ¥327.1bn [8]; LexinFintech ¥205bn [9]; FinVolution ¥200.3bn [10]; X Financial ¥130.6bn [11]; Jiayin ¥129.0bn [12]; Yiren ¥67.8bn [13]. Peers convert at ≈¥6.99/US$1.
Scale of volume is common enough; it is the conversion of that volume into profit and clean credit that separates the field. Qifu earned net income of ¥5,990 million on total net revenue of ¥19,205 million in 2025 [14] — more than twice FinVolution's ¥2.5 billion, the second-highest, and above the other four combined. Its ~31% net margin leads the group, though revenue-recognition differs across these platforms (on-balance-sheet lenders gross up financing income, as covered in Unit Economics), so net income and volume are the cleaner cross-peer lines and margin is directional.
Sources: net income — QFIN ¥5,990m [15], FinVolution ¥2.5bn [16], Jiayin ¥1,535.7m [17], X Financial ¥1,464.6m [18], LexinFintech ¥1,677.1m [19], Yiren ¥54.5m [20]; 90d+ delinquency — QFIN 2.71% [21], LexinFintech 3.1% [22], FinVolution 2.85% [23]. Margins derived from reported net income and revenue; blank delinquency cells denote peers reporting on a >60-day charge-off or vintage basis not comparable here.
The credit outcome reinforces the ranking rather than complicating it. Qifu's 90-day-plus delinquency rate was 2.71% at end-2025 [24], below both of its nearest-size peers — LexinFintech at 3.1% [25] and FinVolution at 2.85% [26]. Larger book, more profit, and cleaner loans in the same year is the empirical signature of a real advantage, not a claimed one.
What the scale buys
Three mechanisms turn that lead into something self-reinforcing rather than a snapshot.
Funding breadth and cost. Qifu had cumulative relationships with 167 financial institutions across 26 provinces and 70 cities at year-end 2025 [27], and it has diversified beyond bank partners into standardized capital markets, cumulatively issuing ¥67.6 billion of ABS and ABN at a 3–4% cost of funds, supported by its own Fuzhou Microcredit lending licence [28]. A larger, more diversified funding stack is a cost advantage that compounds: the platform that can place volume across more funders at a lower marginal rate can price to the borrower more finely and still clear a margin.
Data compounding. The underwriting stack — the Argus Engine for fraud and credit assessment, feeding an A-Score, then a behaviour-based B-Score for existing borrowers, into the Cosmic Cube pricing model [29][30] — improves with repeat interactions. This is where the operating data matters: repeat-borrower contribution was 93.3% in 2025 [31], so the B-Score, which re-scores each drawdown against that borrower's own history, sits on a far deeper behavioural record than a smaller platform can assemble. Qifu directs about 36% of its workforce to research, development and risk, and holds 492 registered patents in China [32][33].
Distribution. Qifu acquires borrowers through an "embedded finance" model begun in 2020, placing its credit and data tools inside high-traffic partners — short-video, e-commerce, ride-hailing and smartphone platforms — and, since 2024, inside financial institutions' own customer bases [34]. Its origin as a 2016 spin-off from the 360 Group [35] gave it a consumer-internet distribution instinct that shows up in the 63.6 million approved-credit-line users on the platform today.
The regulatory turn of 2025 works in the same direction. Qifu's own filing notes that the year's developments have "accelerated the reshaping of the competitive landscape," squeezing smaller platforms as compliance cost rises [36]. A rule that culls sub-scale rivals widens the lead of whoever is already largest.
The read
The evidence supports a narrow but genuine moat: Qifu is the scale leader on volume and profit, with cleaner credit than its nearest peers, and the mechanisms behind that — funding cost, data depth, embedded distribution — compound with size and are being reinforced by a regulatory shakeout. That is a franchise, not a lucky participant. The case against calling it wide is equally concrete: the underwriting edge is thin and cyclical, borrower loyalty is not exclusivity, and the durable funding advantage depends on regulatory access the company does not control. The franchise has already survived the P2P collapse, the 24% price cap, and the 2025 whitelist tightening, which is the strongest single argument for durability.
What would move the read: evidence that a major partner bank has narrowed or dropped Qifu from its funding whitelist would cut the funding mechanism at its root and turn "narrow" toward "eroding"; conversely, a delinquency gap that widens against peers through the current downturn, or a step-up in embedded-finance user share, would show the data and distribution advantages doing real work rather than tracking the industry.
Founder Decoupling
Over three years Qfin dismantled the founder control typical of a Chinese ADR: 20-vote super-voting shares collapsed to one share, one vote in 2023, the "360" brand was retired, and in December 2025 the acting-in-concert tie between founder Hongyi Zhou and Qfin's largest shareholder was severed, so 360 Group's related-party dealings fell away. Control is unusually clean for the group; the cost is that insiders now own just 1.1%, leaving alignment to a distribution policy rather than skin in the game.
Who controls the business, and whether minorities share in what it earns, is the governance pillar of the case — and it feeds directly back into whether the capital return documented in Margin of Safety can be trusted. On the evidence, Qfin's governance has moved in the minority's favour, steadily and deliberately, which is the opposite of the usual China-ADR entrenchment story. The qualifier is that a cleaner structure is not the same as a strongly aligned one.
From super-voting to one share, one vote
At its December 2018 IPO, Qfin — then 360 Finance — was a founder-controlled company in the fullest sense. Hongyi Zhou, the founder of the 360 Group internet empire, was the sole holder of Class B shares carrying twenty votes each, and through them he commanded 76.4% of the company's voting power against a far smaller economic stake [1]. Three years later the arithmetic was unchanged: at the end of 2021 all directors and executive officers as a group held 17.1% of the shares but 75.8% of the votes, the gap being Zhou's super-voting block [2].
That structure is now gone. On the completion of Qfin's Hong Kong secondary listing in November 2022, Aerovane — the vehicle holding the Class B shares — delivered a conversion notice turning every super-voting share into an ordinary one-vote share on a one-for-one basis [3]. An extraordinary general meeting on 31 March 2023 formalised it, re-designating all authorised Class B shares as Class A and changing the company's name from 360 DigiTech to Qifu Technology [4]. As of February 2026 no Class B shares exist and, in the company's own words, "no shareholder had different voting rights from other shareholders" [5].
Source: 2018 — Zhou's 76.4% at IPO [6]; end-2021 — directors and officers as a group 75.8% of votes [7]; Feb-2026 — Aerovane's 19.1%, now one vote per share [8]. The first two bars reflect 20-vote super-voting shares; the last is one-share-one-vote.
The ownership table itself confirms how diffuse control has become. Aerovane holds 46,520,952 shares, or 19.1%; the next-largest disclosed holder, the investment firm Aspex Management, holds 5.3%; and all ten directors and executive officers combined own 1.1%, with the CEO's 0.3% consisting mostly of unexercised options [9].
Source: FY2025 20-F beneficial-ownership table as of Feb 28 2026; public float is the residual [10].
The final step severed even the founder's indirect link. Aerovane is a BVI company owned not by Zhou himself but by his two children, Henry Zhiheng Zhou and Risa Ruoshan Zhou; Zhou had been deemed to beneficially own its shares only through a voting-and-dispositive-power agreement with them. In December 2025 the three signed a termination letter ending that arrangement, and Zhou "ceased to be deemed to beneficially own any" of the shares Aerovane holds [11]. The founder is now, formally, not a beneficial owner of the company he built, and the largest block sits with a family holding vehicle that carries no board seat and no voting premium.
Related-party ties, cut back
The same December 2025 termination cascaded through Qfin's related-party disclosures. Because Zhou no longer controlled the shareholder tie, three counterparties long identified with him — 360 Group, Shanghai Qibutianxia, and Kincheng Bank of Tianjin — all "ceased to be our related party in December 2025," and their year-end balances dropped out of related-party reporting [12]. The framework collaboration agreement with 360 Group, signed at the 2018 IPO to cover technology, user traffic, and trademark licensing, had already been terminated in August 2025 [13]. The app rebrand from 360 Jietiao to Qifu Jietiao in 2024, and the corporate-name change to Qfin Holdings in June 2025, complete the picture: the "360" identity that once anchored user acquisition has been fully retired [14].
The dealings themselves were never large relative to Qfin's ¥5,990 million of net income. Payments to 360 Group for advertising and services ran ¥236.3 million in 2023, ¥233.3 million in 2024, and ¥240.0 million (US$34.3 million) in 2025 — roughly 4% of net income, charged on cost-per-action, cost-per-sale, and fixed-fee formulas [15]. Referral services from Shanghai Qibutianxia stopped entirely after 2023 [16].
Sources: 360 Group services and Qibutianxia referrals [17]; Kincheng Bank deposits [18].
The one item that warranted a second look was Qfin's cash. Through 2023 and 2024 it parked about ¥3.0 billion of deposits at Kincheng Bank of Tianjin, a lender affiliated with Zhou — deposits that earned ¥145.7 million and ¥119.3 million of interest in those years [19]. Placing several billion renminbi of a public company's cash at a founder-affiliated bank is exactly the kind of arrangement a minority holder should scrutinise. By the end of 2025 that balance was nil [20]. The entanglement was real; it has been wound down.
Alignment without a controlling owner
A cleaner control structure resolves the entrenchment risk but creates a subtler one: with the founder's family block held at arm's length, no board seat, and no voting premium, Qfin no longer has a large owner-operator whose personal wealth rides alongside minority holders. Directors and officers own 1.1% of the company, and the aggregate cash paid to all directors and executive officers in 2025 was ¥18.9 million (US$2.7 million) — modest for a business earning ¥5,990 million, which keeps the cost of the management team low but also means their fortunes are only lightly tied to the share price [21][22]. Alignment now runs mainly through option grants and, more importantly, through the capital-return policy: a board-set commitment to distribute 20% to 30% of each half-year's net income as dividends, on top of the buyback [23].
The board that now sets that policy is structurally independent. It has nine directors [24], the chairman and CEO roles are separate, and an independent director, Fan Zhao, chairs both the compensation and the nominating-and-governance committees [25]. The senior operators, though, remain of the 360 lineage — CEO Haisheng Wu was a 360 Group product director and CFO Alex Xu the former co-CFO of Qihoo 360 — so the human continuity with the founder's orbit outlasts the ownership and brand ties that have been cut.
Two caveats keep this from reading as unqualified strength. First, Qfin is a foreign private issuer that elects Cayman home-country governance practice, and its own filing states that neither Cayman law nor its charter requires a majority-independent board, so "our shareholders may be afforded less protection than they otherwise would under the Nasdaq corporate governance listing standards" [26]. The independent board is a choice, not a mandate. Second, the improvements in control cannot reach the structural limits set out in Margin of Safety: Qfin is a Cayman holding company over onshore VIEs, its ability to pay dividends depends on PRC subsidiaries whose distributions are restricted [27], and, because the courts of the Cayman Islands and China offer no reciprocal enforcement of U.S. judgments, "it may be difficult for a shareholder to effect service of process within the United States" against the company or its China-resident directors [28]. Good conduct by the board does not convert an unenforceable structure into an enforceable one.
The read
The governance evidence supports the trustworthy-capital-return read more than it complicates it. Qfin has spent three years doing what most founder-led Chinese ADRs never do: collapsing super-voting control to one share one vote, retiring the brand and framework agreement that bound it to the founder's group, unwinding a multi-billion-renminbi related-party deposit, and finally severing the founder's deemed ownership altogether. Each step reduces the channels through which value could leak away from minority ADS holders, and it happened while the company was also returning roughly half its market value to those holders in a single year. That is a consistent picture: a company being run for its shareholders rather than around them.
The honest counterweight has three parts. Insiders own only 1.1%, so the alignment is procedural — a distribution policy and options — rather than the deep skin-in-the-game of an owner-operator. The capital return that policy produces has been willing but not shrewd: as Margin of Safety showed, the 2023–2025 buybacks were struck at average prices well above today's, so cash was distributed rather than compounded at a discount. And the VIE, currency-control, and enforceability constraints that cap what an ADS holder can actually claim are untouched by any of this.
What would move the read: a resumption of sizeable related-party dealings, or cash again migrating to affiliated institutions, would signal the decoupling was cosmetic; conversely, buybacks executed near or below current prices, or a further tightening of governance to full Nasdaq standards, would turn a clean structure into a demonstrably aligned one. For now the structure is clean, the alignment is adequate rather than strong, and the direction of travel has been firmly toward the minority holder.
The 2026 Inflection Is in Risk, Not Yet in Earnings
Qifu's most recent quarter splits cleanly in two. The leading risk indicators turned sharply for the better in the first quarter of 2026 — new-loan FPD7 fell about 20% sequentially, the post-collection C2M2 ratio dropped to 0.8%, and day-one delinquency and collection rates both improved — as management deliberately shrank the book and cut pricing to reset asset quality. The reported earnings did not follow: net income fell 51% year-over-year to $127.5 million, the fifth straight sequential decline, and the second quarter is guided down another 47–51%. The turn a bull needs has started in the numbers that lead; it has not reached the numbers that pay.
All figures in USD unless noted; renminbi (RMB) amounts are converted at the convenience rate stated in each filing (RMB 6.898 = US$1.00 in the Q1 2026 release, roughly RMB 6.99 in the FY2025 20-F). Rates, margins, and growth are ratios and are currency-independent. Each citation links to the RMB source page. The quarterly trend chart is shown in renminbi so quarters compare on one currency basis.
The capital-return engine paused as the credit turn began
Having returned ~US$0.9bn to holders in 2025 (about 54% of market cap), Qifu paused its share buyback in the first quarter of 2026 — repurchasing only US$577m of convertibles for US$502m of cash — while reported net income fell 51% year-over-year to RMB879.8m and 90-day-plus delinquency rose to 3.50% from 2.71%, even as the company still generated RMB2.1bn of operating cash and cut leverage to 2.4x. [1] [2] [3] [4] [5] [6].
The retreat was in the buyback, not the balance sheet. Management kept retiring the 2030 convertible notes — about US$577 million of principal for US$502 million of cash, leaving roughly US$113 million outstanding — but framed the equity program only as something it "may start to opportunistically look into an entry point to resume," language that implies the open-market buyback was idle in the quarter [7] [8]. Cash conversion held: RMB2.1 billion of operating cash funded the note repurchases and cut the leverage ratio to 2.4x from 2.7x, so the pause reads as caution and debt reduction rather than a cash constraint, and the dividend the Margin of Safety chapter details was left in place [9].
What is at stake is timing against price. In 2025 Qifu returned close to US$0.9 billion — US$693 million (RMB4.85 billion) of ADS repurchases and US$192.4 million (RMB1.38 billion) of dividends, about 54% of today's market value — but those buybacks were struck above the current quote, so each dollar retired fewer shares than it would now [10] [11]. The ~US$0.71 billion (RMB4.96 billion) of net-liquid assets the Margin of Safety bridge isolates is roughly US$5.8 per ADS against the 121.9 million ADSs outstanding; deployed at the ~US$13.4 price it would retire on the order of 53 million ADSs — about 44% of the share count — and well below the ~US$28 book value per ADS [12]. A continued pause defers that accretion; a resumption at sub-book prices captures it. The choice the quarter poses is when to spend, not whether the cash exists.
Earnings have fallen for five straight quarters
The de-rating Business and Repricing described was priced off a profit line that has kept sliding. Quarterly net income peaked at RMB1,912.7 million in the fourth quarter of 2024 and has declined every quarter since, reaching RMB879.8 million ($127.5 million) in the first quarter of 2026 — down 54% from the peak and 51% from a year earlier [13]. Revenue peaked two quarters later, in mid-2025, and has since fallen three quarters running to RMB3,909.3 million ($566.7 million), down 16.6% year-over-year [14]. The GAAP net margin has compressed in a near-straight line, from 42.7% at the Q4 2024 peak to 22.5% in Q1 2026 [15].
Source: quarterly results releases; the latest quarter and its year-earlier comparative from the Q1 2026 release [16]; prior quarters as reported in the respective releases.
Two forces sit behind the slide, and separating them is much of the work. Part is the contraction management chose: total facilitation volume fell 26.8% year-over-year to RMB65.0 billion and the outstanding book shrank 18.5% to RMB114.4 billion as the company tightened credit and let legacy loans run off [17]. Part is the credit cost of the loans already on the book: provision for loans receivable rose to RMB1,234.7 million ($179.0 million), up from RMB823.2 million a year earlier and RMB1,190.3 million in the prior quarter, because the booking ratio increased even as origination fell [18]. The reserve build the report has tracked (Reserve Quality) is still running, not reversing.
The leading indicators turned; the lagging one has not
Underneath the falling profit, the credit metrics that lead new-loan performance improved markedly, and did so because management engineered it. FPD7 — first-payment delinquency at seven days, the earliest read on a new vintage — fell about 20% sequentially; the C2M2 ratio, which measures outstanding delinquency after 30 days of collection, fell 17% to 0.8% and by March had returned to the levels of July–August 2025 [19]. Day-one delinquency eased to 5.7% from 6.1% [20], and the 30-day collection rate rose 1.8 points to 85.8% [21].
The one delinquency figure still rising is the backward-looking one. The 90-day-plus rate climbed to 3.50% at end-March from 2.71% at end-2025 — the extension of the deterioration Unit Economics flagged. Management's own framing is worth weighing on both sides: the CFO called the 90-day-plus rate "a lagging indicator" that reflects the elevated risk of late 2025, "not a metric we care much about" internally [22]. That is a fair description of how these curves work — a 90-day bucket today is populated by loans written months ago — but it is also the metric an outside skeptic trusts most, precisely because it is realized rather than modeled. The honest read is that the front book is healing while the back book is still working through its worst vintages.
Source: Q1 2026 earnings call — CFO metrics [23], collection rate from prepared remarks [24]. FPD7 (new-loan first-payment delinquency) fell about 20% sequentially and is a change, not a level, so it is not tabled [25].
The earnings kept falling because the reset is deliberate
The gap between improving risk and falling profit is not an accident of timing — it is the trade management says it is making. To acquire higher-quality borrowers, Qifu cut average loan pricing about 80 basis points sequentially [26], taking the average IRR of originated loans to 18.7% from 19.5% in the prior quarter [27]. Management framed this in plain terms as "a trade-off between near-term profit and long-term sustainable value": lower price and lower volume now, in exchange for a cleaner, stickier book later [28]. The industry backdrop makes the shrinkage partly involuntary too: Chinese household short-term consumer-loan balances fell for a fifth straight quarter, down roughly 5% sequentially, so demand is contracting alongside supply [29].
That reframes the take-rate compression from Unit Economics. Some of it is price the company gave away on purpose to win better credit, not price regulators or competitors forced out of it — a distinction that matters for whether the lost margin comes back. There are corroborating green shoots. Platform-services revenue rose 44% sequentially to RMB951.9 million on a better ICE take rate, the capital-light line the report has watched most closely [30]; the technology-solutions channel facilitated RMB9.96 billion of volume, roughly seven times a year earlier, though off a small base [31]. The counter-fact a bull must hold is repeat-borrower reliance: contribution fell to 86.8% in the quarter [32], from 93.3% for full-year 2025, the mechanical result of leaning into new customers whose long-run performance is still unproven [33].
What the quarter says forward
The clearest forward signal is that the sequential bleed is guided to stop. For the second quarter of 2026 management guided non-GAAP net income of RMB900–980 million, a midpoint essentially flat against the RMB945.9 million just reported — the first quarter in over a year without a sequential decline — even as the year-over-year comparison stays down 47–51% against a high first-half 2025 base [34]. Consensus embeds the same shape: full-year 2026 earnings per ADS down about 37%, then roughly flat-to-up in 2027, with the analyst price-target mean near $22 against a $13.4 quote. The market took the print as a forming trough: the shares rose about 4.5% on the day, on results that beat on both revenue and EPS.
Q1 Revenue ($M)
Q1 Net Income ($M)
Non-GAAP Op. Margin
Diluted EPS/ADS
Source: Q1 2026 results release; figures in US$ millions except EPS [35] [36]. Non-GAAP operating margin excludes share-based compensation. Analyst price targets and the day-one share reaction are from consensus data and contemporaneous reporting, as reported.
Reading the quarter
For the question the report set — whether the de-rating marks durable impairment or a cyclical trough — this quarter tilts the evidence toward cyclical, but not yet troughed. The metrics that lead earnings by two to four quarters (FPD7, C2M2, day-one delinquency, collection) all turned up, and management is visibly steering the reset rather than being overrun by it; the sequential earnings decline is guided to end next quarter. That is what an early cyclical bottom looks like.
The case against reading it as a clean bottom is on the same page. The 90-day-plus book is still deteriorating, provisions are still building into a shrinking loan base, repeat-borrower reliance has dropped as the mix churns toward unproven new customers, and the buyback that anchored the return case went quiet. A single quarter of improving leading indicators, in a business whose reported profit is still halving year-over-year and whose second-quarter guide is another 47–51% down, is a start, not a confirmation.
What would settle it is observable and close. Two more quarters of stable-to-improving C2M2 feeding into a 90-day-plus rate that rolls over; a non-GAAP profit line that actually holds its sequential floor as guided; and the buyback resuming at these prices rather than staying paused. If those arrive together through the second half of 2026, the durable-impairment reading weakens materially. If the 90-day-plus rate keeps climbing past 3.5% while the profit floor gives way, the cyclical-trough story is the one that breaks.
Reconciling the case, and the signals that settle it
Having traced a cash-generative scale leader now trading below book, the report reaches the question no single chapter settles: whether that discount is durable impairment or a cyclical trough. This closing chapter does two things the earlier ones could not: it reconciles the bull and bear reads on the same shared facts, and it names the dated, observable signals that will decide between them.
Figures are shown in renminbi (RMB) with U.S.-dollar equivalents at the roughly RMB 6.99 = US$1.00 convenience rate used in the FY2025 20-F, or the RMB 6.898 rate in the Q1 2026 release for that quarter; ratios and growth are currency-independent. The ADS reference price is US$13.38 (27 Jul 2026). Each citation links to the source page.
The evidence, reconciled
Every load-bearing fact in this report reads two ways depending on whether the 2025–26 decline is cyclical or structural. Setting the bull and bear interpretations against the same number — rather than against each other's rhetoric — is what shows how little separates them and how few observations would decide it.
Sources: valuation and returns, FY2025 20-F Consolidated Balance Sheets and Statements of Operations [1] [2]; reserve sensitivity p.157 [3]; regulation p.108 and Q4 2025 call [4] [5]; Q1 2026 credit metrics [6]; parent cash p.270 [7].
The reconciliation the earlier chapters build to is this. On valuation and reserves, the circularity the earlier chapters isolate (Margin of Safety, Reserve Quality) is exact: Qifu trades at 0.47x book (US$1.63bn market value vs US$3.45bn equity) and ~1.9x trailing earnings, yet both the book and the earnings are set by a single unverifiable input — the expected-default estimate Deloitte named its sole 2025 critical audit matter — whose 0.5-percentage-point move swings reserves by RMB753.6m (~13% of the RMB5,989.7m net income), so the asset floor is not independent of the earnings risk it is meant to cushion, and only ~US$74m of the group's cash sits at the listed parent. [8] [9] [10]. On the franchise, Qifu is the empirical scale leader of the listed Chinese credit-tech group — RMB327.1 billion (US$46.8 billion) of 2025 volume across 63.6 million credit-approved users (Scale and Moat) [11] — but that scale runs through a funding channel regulators now gate, and the capital-light referral engine that best expressed it contracted sharply once the whitelist rules landed (Whitelist Regime) [12]. The two sides are not arguing about different facts; they are weighting the same ones toward different endings.
Three ways the next two years run
The case is most sensitive to the credit path — whether the improvement in the leading indicators shown in Leading vs Lagging reaches the loss line, or the back book keeps the realized 90-day-plus rate climbing. That single variable, more than valuation or regulation, separates the three scenarios below. The valuation frames are illustrative arithmetic anchored to the US$3.45 billion book and the RMB5,989.7 million 2025 profit, not price targets; each moves with the driver named beside it.
Source: scenario arithmetic derived from FY2025 net income and book equity [13] [14]; 2026 consensus (~-37% net income) and the ~US$22 analyst price-target mean are from consensus data, as reported.
The distances between these outcomes are wide but bounded, and the arithmetic makes the asymmetry concrete. In the base case, a company earning even a flat ~US$540 million and returning cash at more than half its market value a year compounds a large return from a 0.47-times-book start, with the dividend alone near 12% of the price (Margin of Safety) [15]. The bear case is not a zero — it is a business that keeps earning but at a mid-single-digit return on equity, where a sub-book multiple is deserved and book value itself leaks as reserves rebuild off the same estimate that governs earnings [16]. The sell-side, with a mean target near US$22 against the US$13.38 quote, is priced roughly to the base case; the shares are priced closer to the bear.
What to watch
The scenarios resolve on a small set of observations, each attached to a specific filing line, a window, and a threshold that would move the read. They are ordered by how cleanly each one discriminates between the cyclical and structural stories.
Sources: profit-floor guidance and buyback status, Q1 2026 results release and call [17] [18]; delinquency and take-rate metrics, Q1 2026 call [19]; whitelist and Sep-2026 online-marketing measure, FY2025 20-F [20]; Aug-2026 comprehensive-cost Provisions, per peer FY2025 20-F [21]; overseas expansion, Q1 2026 call [22].
The top two are the ones that most cleanly settle the through-line. If the 90-day-plus rate — the realized, not modeled, metric a skeptic trusts — peaks and rolls over in the second half of 2026 while the non-GAAP profit holds the floor management guided, the cyclical-trough reading strengthens and the base case comes into view [23] [24]. If instead the 90-day-plus rate keeps climbing past 3.5% while the profit floor gives way, the durable-impairment case is the one the evidence supports. The buyback is the tell on management's own conviction: with roughly US$0.71 billion of net liquid assets on hand, resuming repurchases at today's sub-book price would create per-share value rather than merely distribute cash, and its absence would say management sees the risk the bear does [25].
What the corpus cannot settle
Three questions matter to the outcome and cannot be answered from the filings to date, so they belong on the watch list rather than in the analysis as fact.
The first is whitelist inclusion. The 20-F flags exclusion from partner banks' whitelists as a risk but does not disclose whether Qifu is actually on those lists; with the top five bank partners supplying about 35.1% of 2025 funding, a confirmed inclusion would move the funding-access bind from medium toward benign, and a material exclusion the other way [26]. The second is the durability of the funding cost: with on-balance-sheet lending now about a third of the book, the roughly 3%-of-revenue funding cost has not been stress-tested against a genuine tightening of onshore liquidity (Unit Economics). The third is the overseas business. Management's "1-core, 2-wings" push is live — the United Kingdom and a Latin American country launched in the first quarter of 2026, with Southeast Asia planned — but it is explicitly "still in the early stage of investment," and its size, unit economics, and whether it diversifies the single-country regulatory concentration are unquantified [27]. One structural overhang also sits unresolved: with the acting-in-concert arrangement terminated in December 2025, the 19.1% Aerovane block held by the founder's children is now ordinary stock, and how it is voted and whether it is eventually sold down are open (Founder Decoupling).
Where the balance sits
Held to the arithmetic, the weight of the evidence in this report sits between the base and bear cases and, on the most recent data, has edged toward the base. The discount is genuine rather than a pure trap: Qifu is the scale leader of its segment, it moved roughly US$0.9 billion to shareholders in 2025, the pricing shock the market feared was absorbed three years ago, and the leading credit indicators have begun to turn [28] [29]. The discount is also partly earned: the cheap earnings run off a lightly provisioned base, the book and the profit lean on one credit estimate, and the return engine paused just as the shares grew cheapest [30] [31].
What would move the read toward mispricing is a 90-day-plus rate that peaks in the second half of 2026, a non-GAAP profit that holds its floor, and a buyback resumed at these prices. What would confirm the trap is a deeper credit down-leg that pulls earnings and book down together, or an obstruction to getting the cash out. Both paths are observable within a few quarters, on lines that already exist in the quarterly release. For a buyer of cheap companies, the discount is large enough that the base case pays well and the bear case is survivable; the signals above are what turn that from a statement about price into a decision that can be checked against the record as it arrives.